
FIGURE 1.
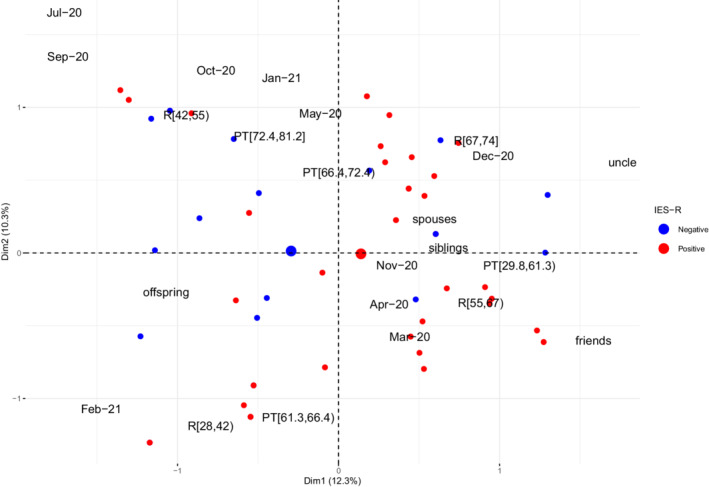
Biplot of individuals and variables in two multiple correspondence analysis (MCA) dimensions. Blue dots denote individuals interviewed with a negative IES‐R score, whereas red dots denote individuals with a positive IES‐R score. MCA refers to the time of death (month‐year: Mar‐20, Apr‐20, May‐20, Jun‐20, Jul‐20, Sep‐20, Oct‐20, Nov‐20, Dec‐20, Jan‐21, Feb‐21), degree of kinship with the patient (friends, spouses, offspring, siblings, uncle), and patient (PT) or interviewed relative's (R) age. Age is reported as quartiles. Age for PT: PT[29.8,61.3), PT[61.3,66.4), PT[66.4,72.4), PT[72.4,81.2]; age for interviewed relatives: R[28,42), R[42,55), R[55,67), R[67,74].“(“or”)” and “[“or”]” denote open and closed intervals. The Dim1 axis (i.e., “degree of kinship”) is the first dimension along which the sample shows the largest variation, whereas the Dim2 axis (i.e., “age”) is the second‐largest dimension and it is orthogonal to Dim1, which explains 12.3% of the variation in the data