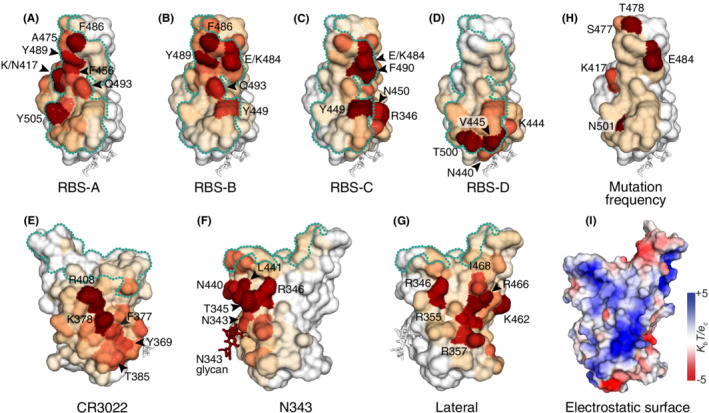
FIGURE 3.

Essential residues in each epitope sites on the RBD. The RBD is shown in surface representation and N343 glycan in stick mode. The footprint of ACE2 binding on the RBS is shown as a cyan dotted line. Epitope sites, RBS‐A (A), RBS‐B (B), RBS‐C (C), RBS‐D (D), CR3022 cryptic site (E), N343 proteoglycan site (F), and lateral RBD site (G) are colored according to aBSA normalized within each epitope group. The most vulnerable epitope residues are indicated in each panel. (H). Mutational frequency (from white to beige to red) in SARS‐CoV‐2 RBD using genomic analysis data from GISAID. The redder colors represent higher mutational frequency in the SARS‐CoV‐2 RBD. (I). Electrostatic surface of SARS‐CoV‐2 RBD. Charge potential was calculated using APBS plugin in PyMol software. The perspective view is the same as G for easy comparison
