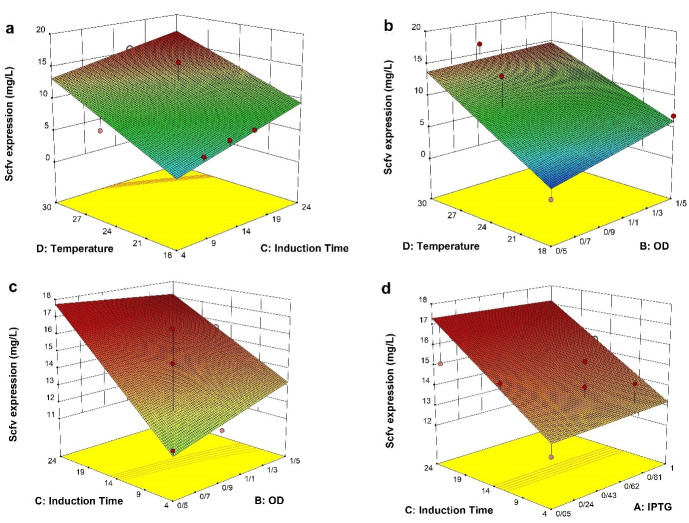
Figure 3.
The interaction functions of variables. The response surface plots represent the interaction effects of a different variable on the expression of scFv. The blue color signifies the minimum value (0.03 mg/L), whereas the red color represents the maximum value (16.6 mg/L). a) The induction time/temperature time interaction (CD), b) The induction OD600/temperature interaction (BD), c) The induction OD600/induction time interaction (BC), d) The IPTG/induction time interaction (AC).

