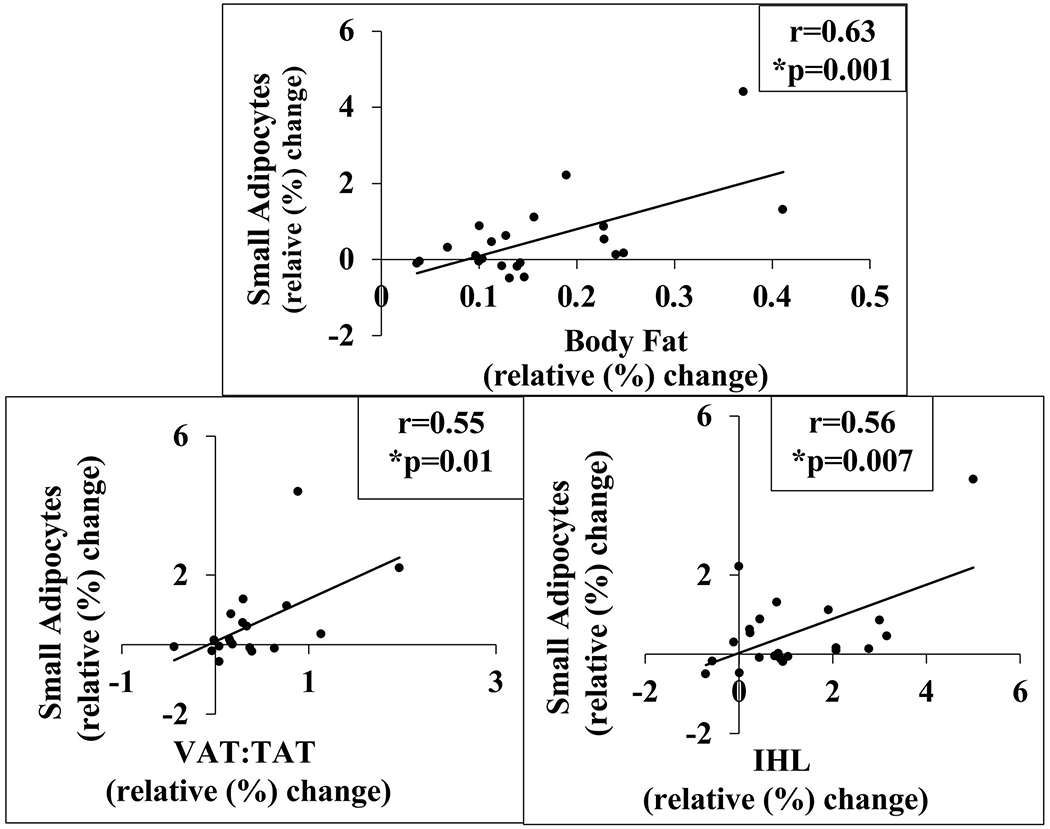
Figure 1. The relative (%) change in small adipocytes in response to overfeeding was positively associated with the % changes in body fat (A), abdominal VAT:TAT (B), and IHL (C), but not SAT mass.

Simple associations between the % change in small adipocytes versus % changes in body composition and ectopic lipid were examined using Pearson’s correlation coefficients. The Pearson’s correlation between % change in small adipocytes and % change in body fat is 0.63 (R2=0.39; p=0.001) and is 0.17 (R2=0.03; p=0.47) between % change in small adipocytes and % change in SAT mass. The Pearson’s correlation between % change in small adipocytes and % change in VAT mass is 0.57 (R2=0.32; p=0.0003), is 0.55 (R2=0.32; p=0.01) between % change in VAT:TAT and % change in small adipocytes, and is 0.56 (R2=0.31; p=0.007) between % change in small adipocytes and % change in IHL. *Three participants did not complete the MRI, therefore, the total number of subjects with VAT data is N=19. The % change in IHL data was reanalyzed excluding data from two participants with % IHL of 17% and 10%. The Pearson correlation is 0.35 (R2=0.12; p=0.12).
