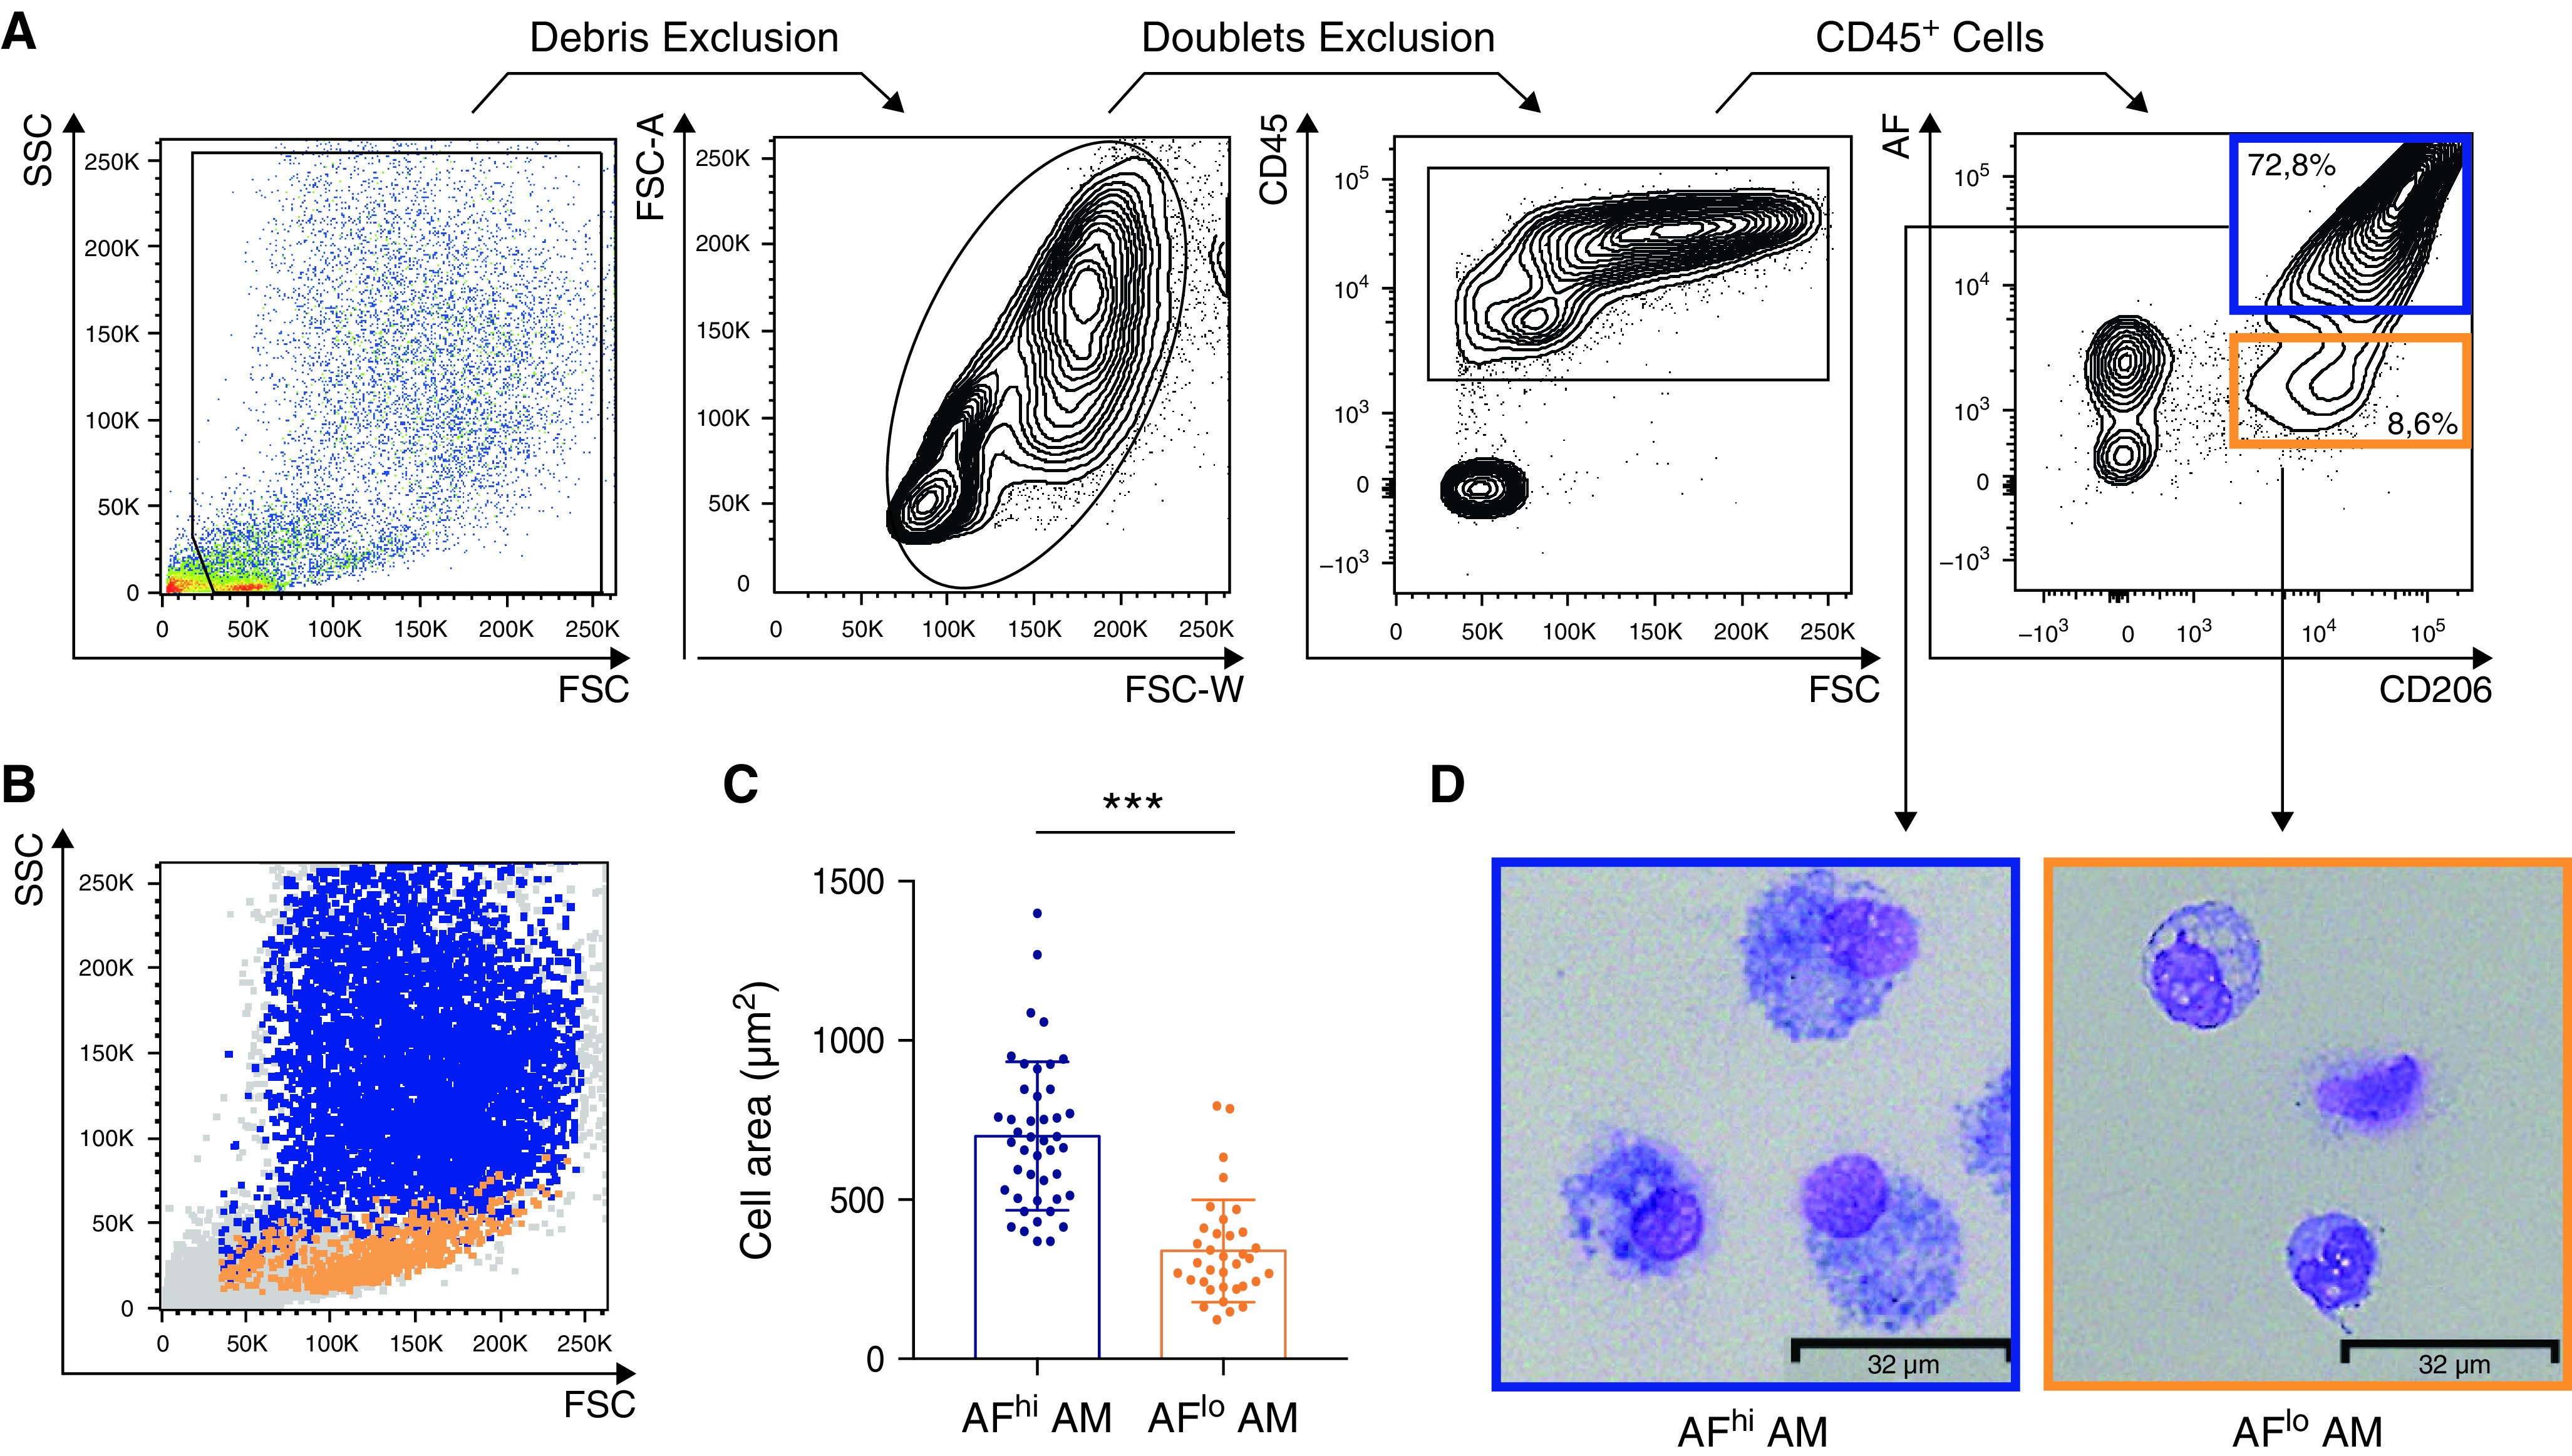
Figure 1.

Alveolar macrophages (AMs) collected by BAL encompass small autofluorescentlow (AFlo) and large autofluorescenthigh (AFhi) CD206+ macrophages. (A) Representative flow cytometry gating strategy to delineate BAL fluid (BALF) CD206+ AFlo (orange box) and AFhi (blue box) macrophages. (B) Representative side scatter (SSC) versus forward scatter (FSC) plot depicting AFlo (orange) and AFhi (blue) macrophages. (C) Quantification of the size of AFlo and AFhi AMs. (D) Representative photographs of FACS-sorted AFlo and AFhi AMs. (A, B, and D) Data are representative of 1 of more than 10 experiments, each showing similar results. (C) Data show mean + SEM, as well as individual cells (n = 10 donors, 2–8 cells per donor). P values were calculated using a two-tailed paired Student’s t test. Scale bars = 32 μm.
