Figure 3.

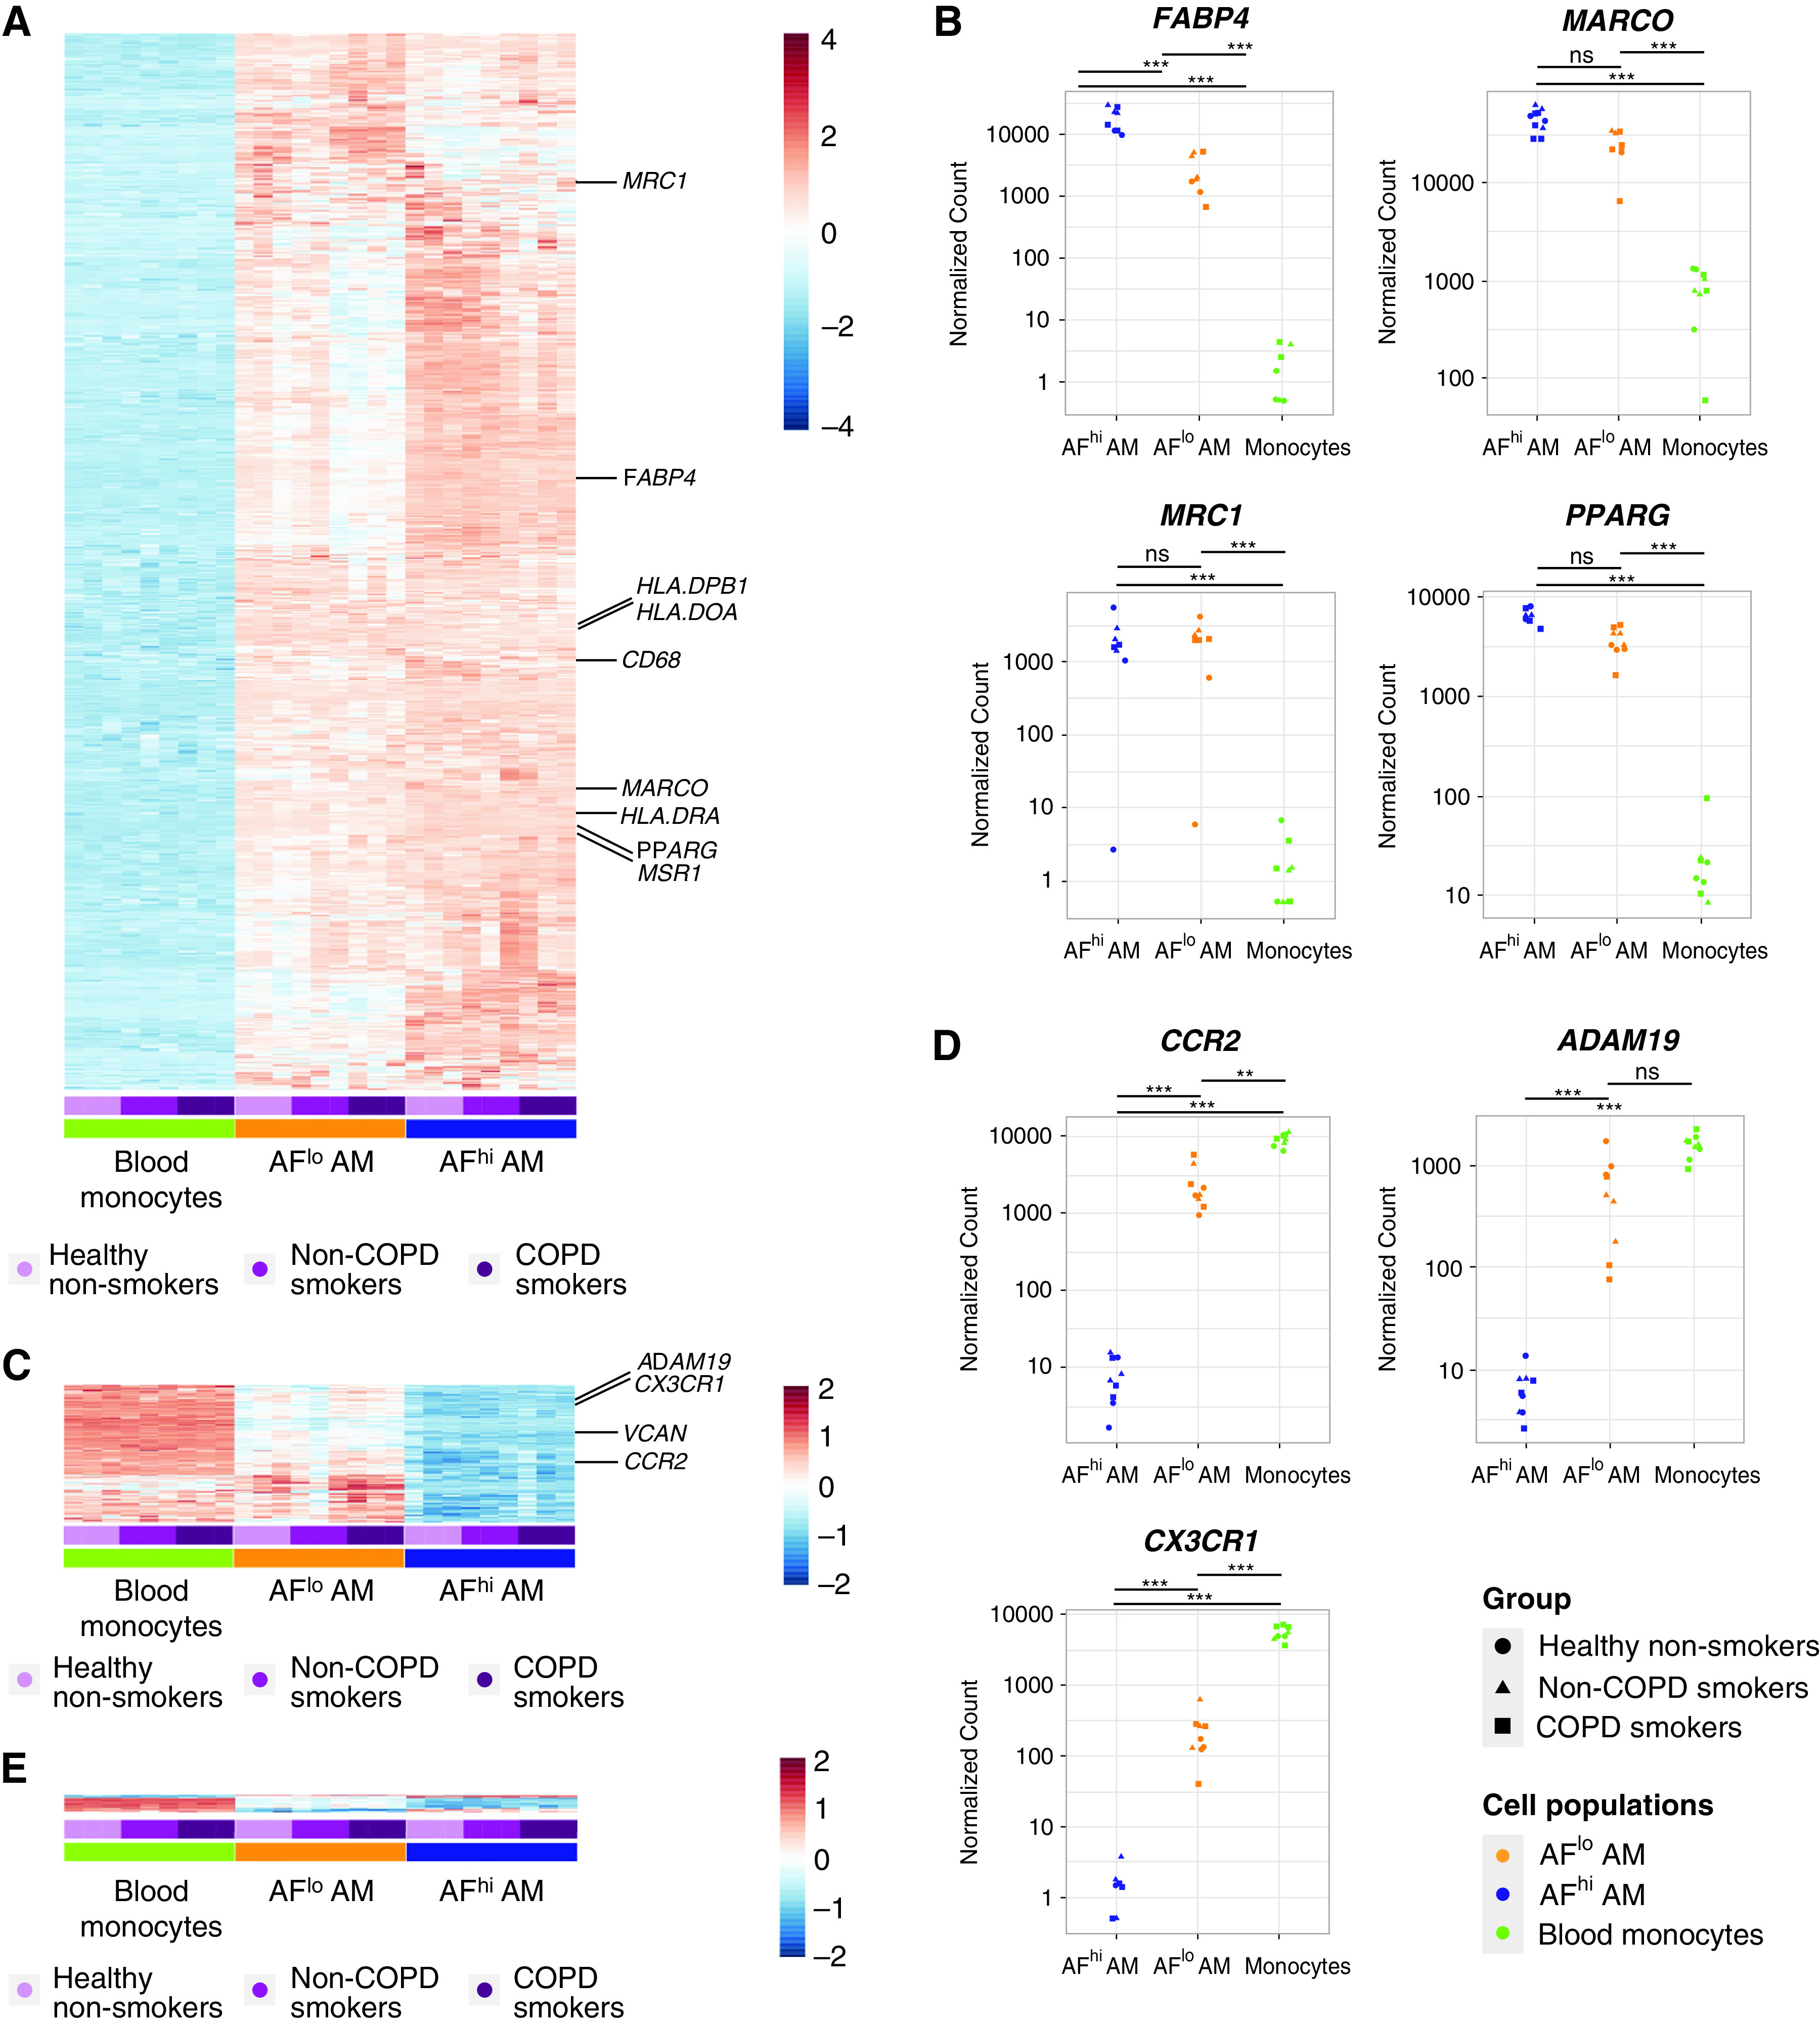
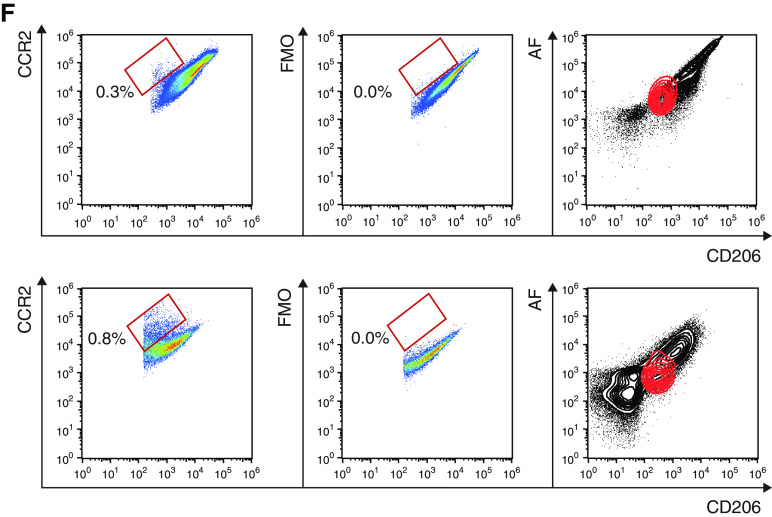
AFlo AMs share both AM- and monocyte-associated transcriptional signatures. (A) Heatmap depicting the list of significant DE genes jointly upregulated in AFlo or AFhi AMs as compared with blood monocytes. (B) Individual expression, shown as normalized counts, of the indicated genes within the indicated cell populations. (C) Heatmap depicting the list of significant DE genes commonly upregulated in blood monocytes or AFlo AMs as compared with AFhi AMs. (D) Individual expression, shown as normalized counts, of the indicated genes within the indicated cell populations. (E) Heatmap depicting the list of significant DE genes commonly upregulated in blood monocytes or AFhi AMs as compared with AFlo AMs. (F) CCR2 protein expression on BALF CD45+CD206+ macrophages (HD20 and HD21) (see Table E1). Representative flow cytometry plots showing CCR2 versus CD206 expression on BALF macrophages stained with (left) an anti-CCR2 or (center) FMO. Inserts indicated % of CCR2+ cells in the parent gate; (right) flow cytometry plots showing AF versus CD206 expression on total BALF CD45+ cells (gray) or CCR2+ macrophages (red). (B and D) P adjusted values are shown and were estimated thanks to the DESeq2 package. AF, auto-fluorescent; DE, differentially expressed; FMO = fluorescence minus one; HD = human donor; ns = nonsignificant. **P < 0.01 and ***P < 0.001.

