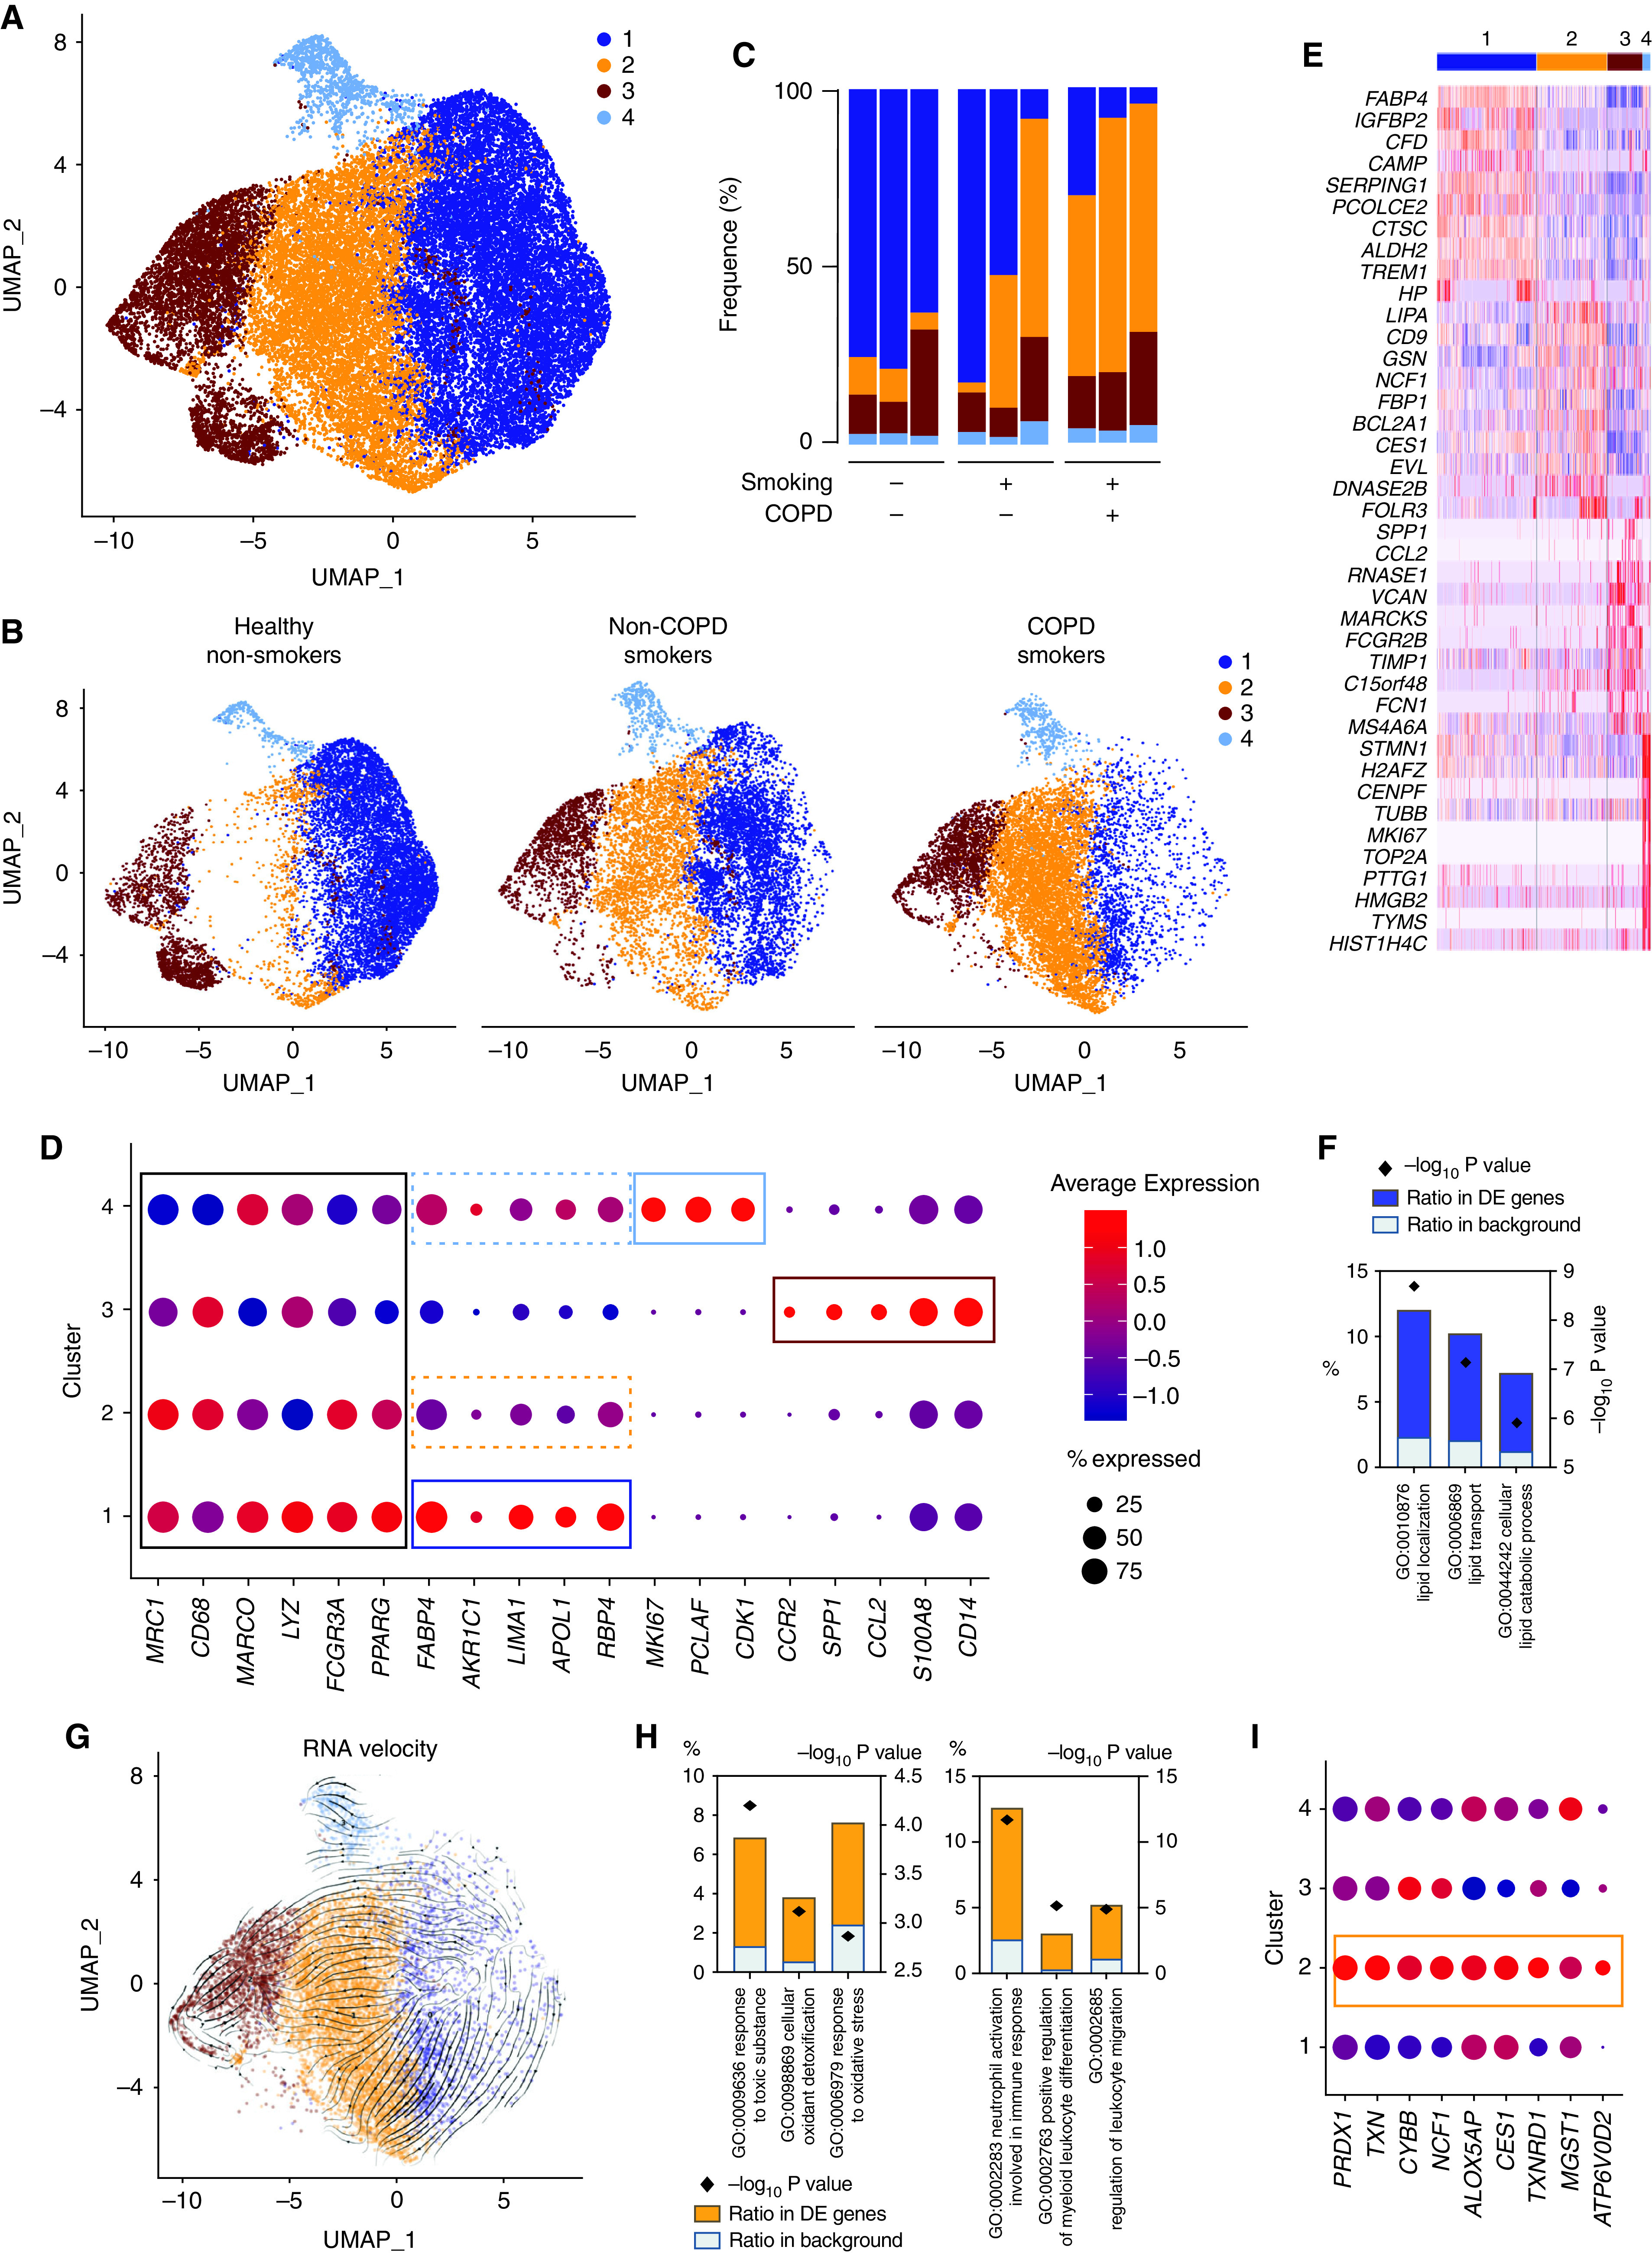
Figure 5.

BALF myeloid cell heterogeneity revealed by single-cell (sc) RNAseq analyses. (A) Uniform manifold approximation and projection (UMAP) plot depicting BALF myeloid cells from the merged biological samples. (B) UMAP plots depicting BALF myeloid cells isolated from healthy nonsmokers (left), smokers without COPD (middle), and smokers with COPD (right). (C) Histogram showing percentage of each cluster within individual samples. (D) Dot plots showing average expression and percentage of cells expressing the indicated genes within cell clusters. (E) Heatmap depicting the 10 most upregulated genes in each cluster. (F) Histograms showing results of gene ontology (GO) enrichment tests for the upregulated genes in cluster 1 as compared with the other clusters. (G) Patterns of RNA velocities of single cells from smokers with COPD substantiated by arrows visualized on the UMAP plot. (H) Histograms showing results of GO enrichment tests for the upregulated genes in cluster 2 as compared with cluster 1. (I) Dot plots showing average expression and percentage of cells expressing the indicated genes within cell clusters.
