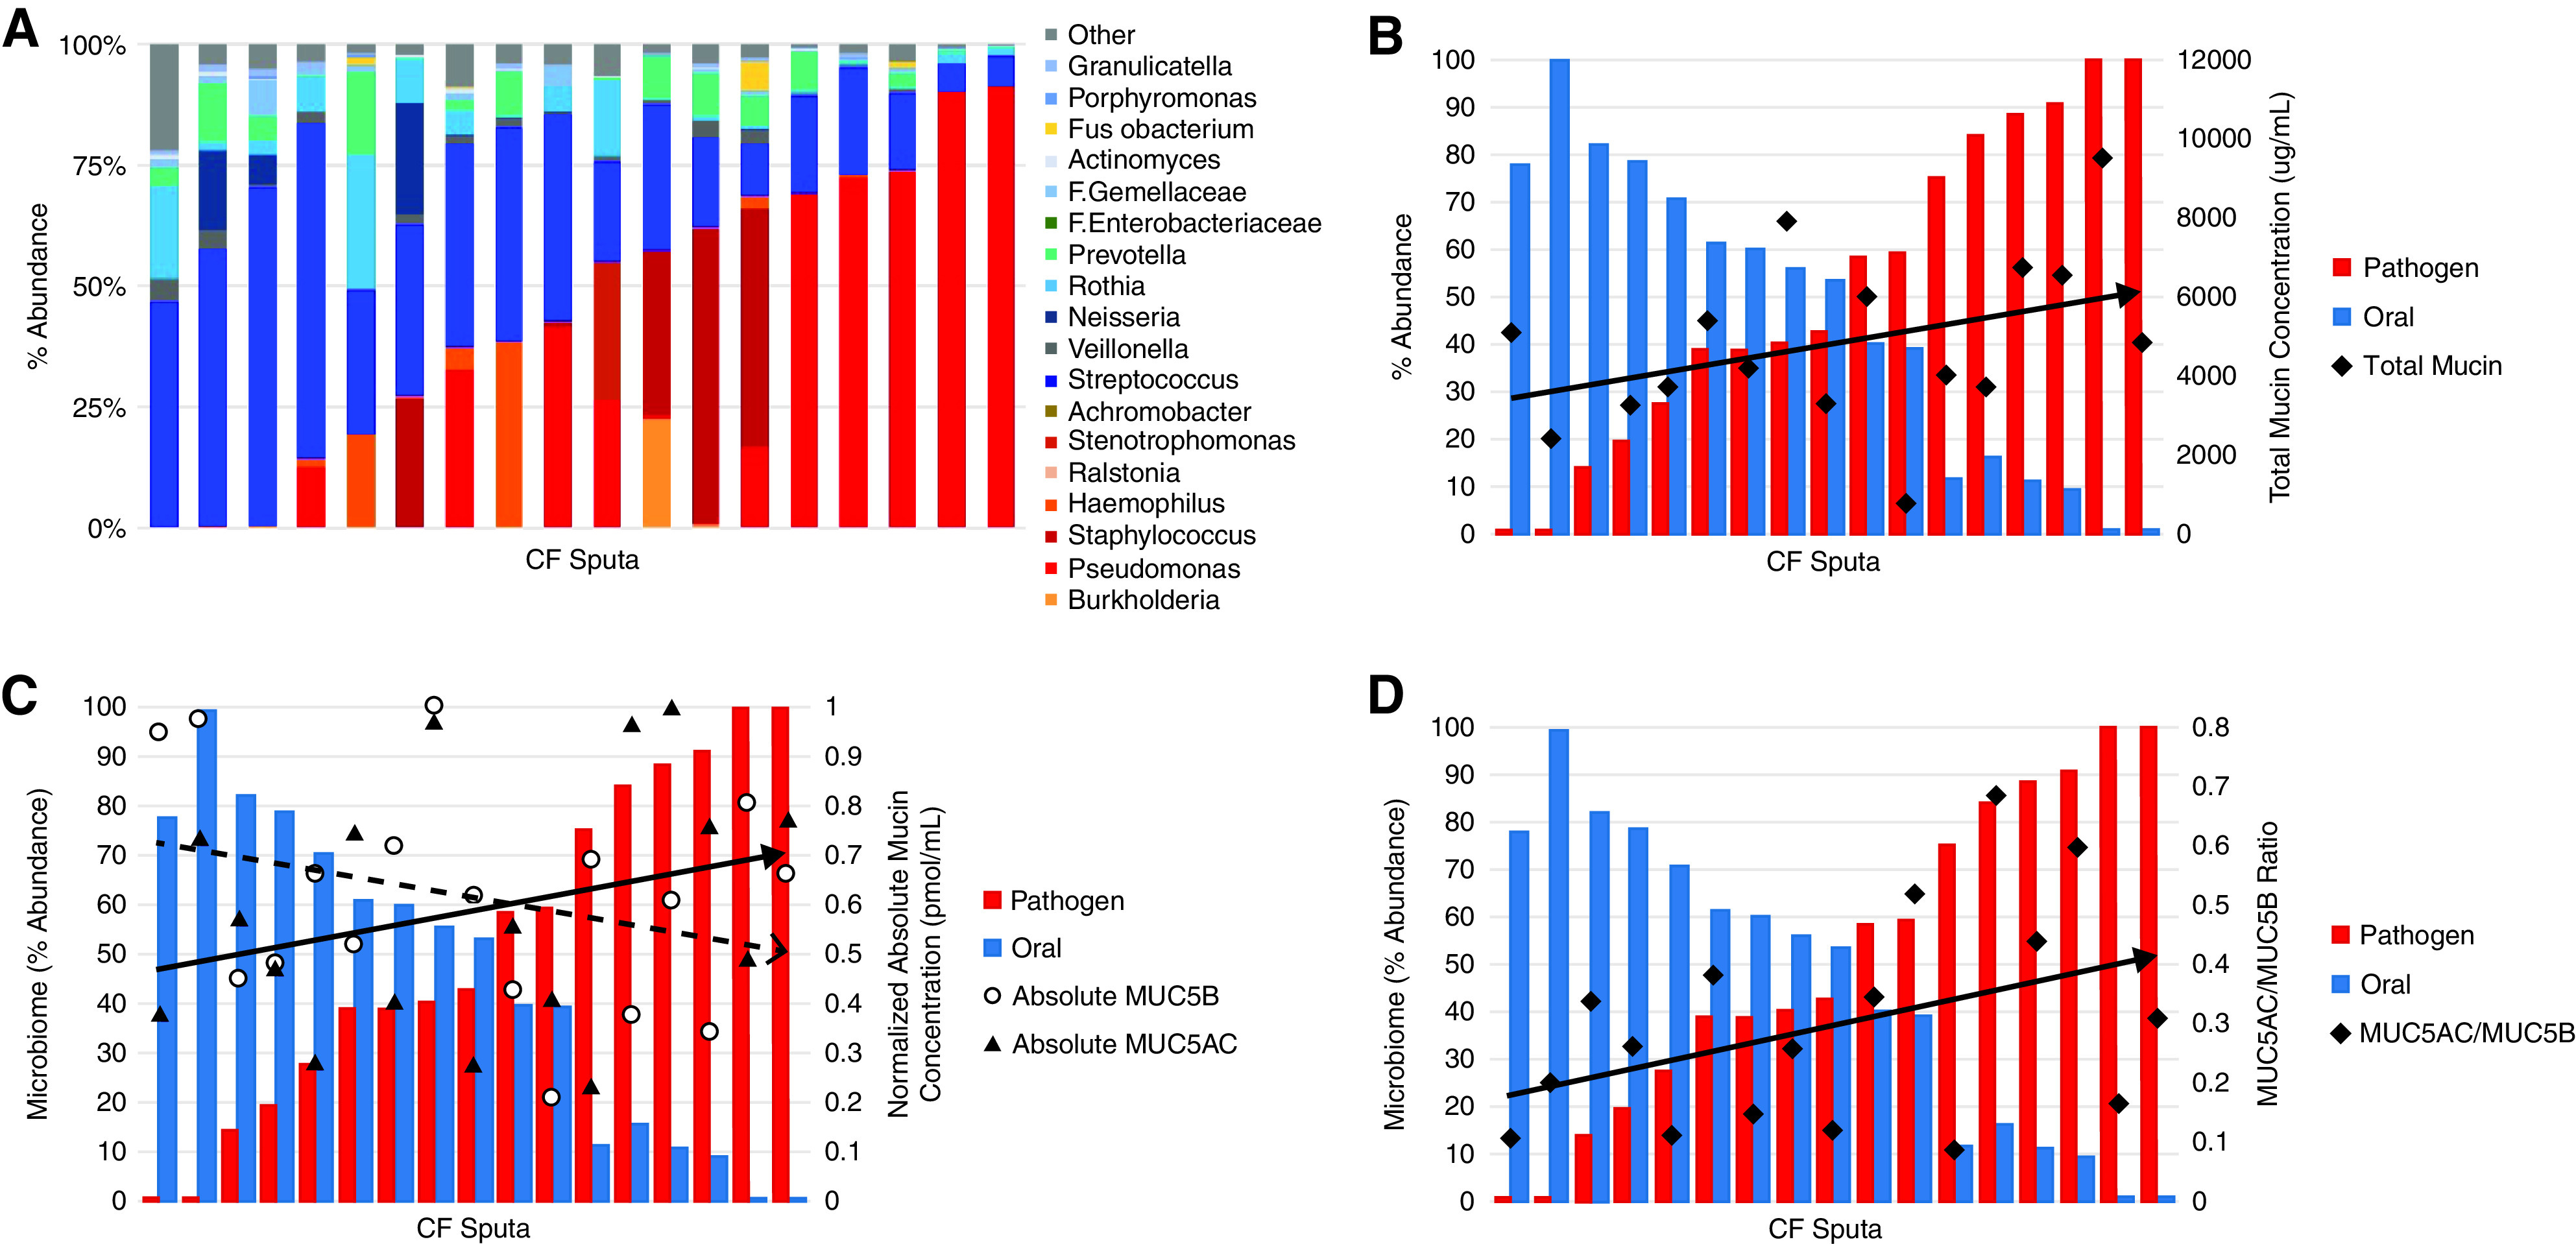
Figure 5.

Relationship between microbiome and mucin concentrations. (A) Abundance of bacterial genera based on sputum microbiome sequence analysis shows stratification on the basis of oral flora or classic pathogen classification. 16s rRNA sequencing identified microbiome composition of a subset of CF sputum samples (n = 20). Each column represents one sputum sample. Cool-toned bars (blue/green) indicate that the genera is commonly identified as part of the oral flora community and warm (red/orange) toned bars indicate microbe is typically identified as a CF lung pathogen. (B) Total mucin concentrations compared to abundance of genera classified as either oral flora or pathogen (r = 0.42; P = 0.053). Absolute quantitative LS-MS/MS using labeled peptides was used to determine MUC5AC and MUC5B concentrations and the ratio between them (C), which was compared with microbiome data. Each pair of blue and red bars represents one CF sputum sample (n = 17), which were arranged by increasing pathogen abundance from left to right. The ratio reflects the relationship between the absolute concentrations (C) of MUC5AC (black triangles, r = 0.32; P = 0.22) and MUC5B (open circles, r = −0.41; P = 0.11). (D) MUC5AC/MUC5B ratio versus pathogen abundance (r = 0.48; P = 0.062).
