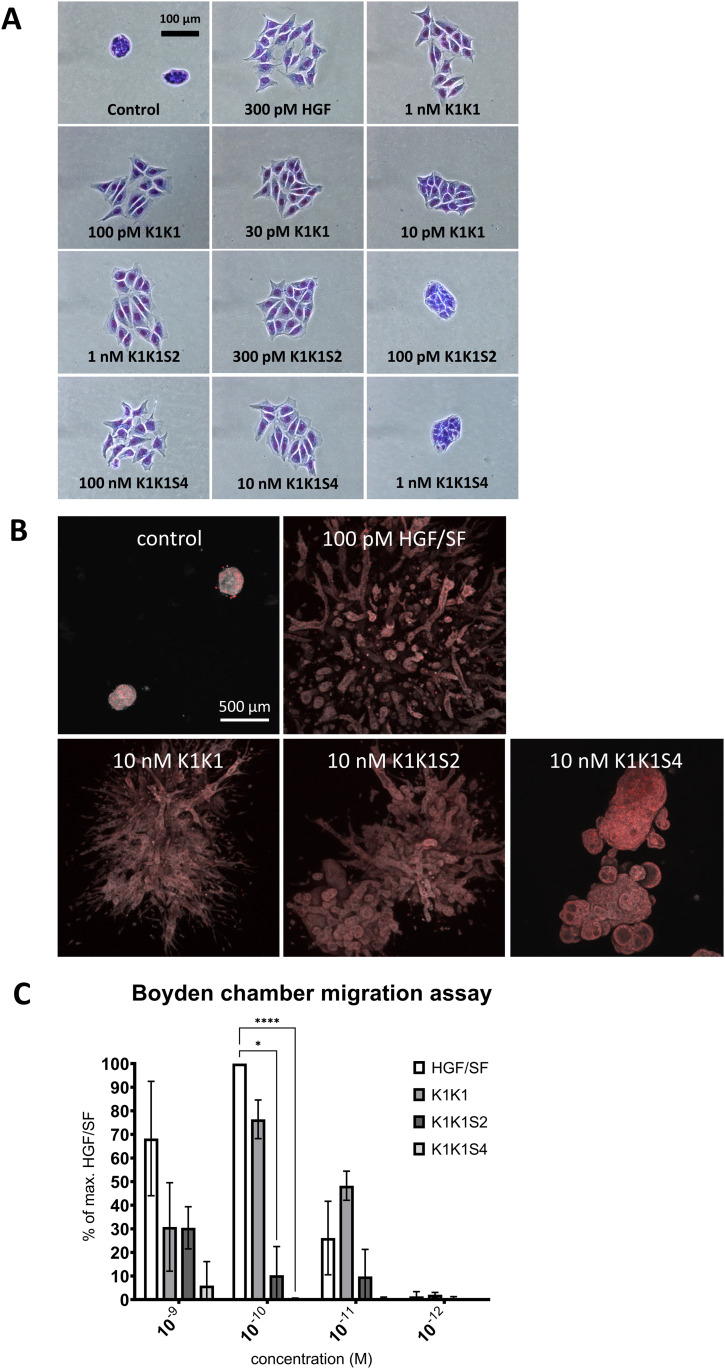
Figure 6. Effects on cell motility, migration, and morphology.
(A) MDCK cell scattering at different concentrations K1K1, K1K1S2, and K1K1S4 showing the lowest concentration at which each protein is still active and the subsequent dilution at which no more scattering is observed. Hepatocyte growth factor/scatter factor (HGF/SF) is used as positive control to generate maximum scattering. For complete half-log dilution of agonist series, see Data Source Image File. (B) 3D reconstruction by z-stacking of fluorescence microscopy images taken of large MDCK cell colonies stimulated with 100 pM HGF/SF or 10 nM K1K1 and mutants for 4 wk. The combined fluorescence of DAPI (red) and Evans blue staining (grey scale) shows the extensive branching morphogenesis and tubulogenesis induced by both proteins. (C) Boyden chamber migration assay using SKOV3 cells. Three independent assays were performed in which SKOV3 cells were treated for 6 h with indicated concentrations of HGF/SF, K1K1, K1K1S2, and K1K1S4. 0.1 nM HGF/SF was taken as 100% to which all other conditions where compared. Statistical significance was calculated with ANOVA followed by Dunnett’s test with P < 0.05 and * indicates significantly difference. Error bars represent mean ± SD based (n = 5).
Source data are available for this figure.

