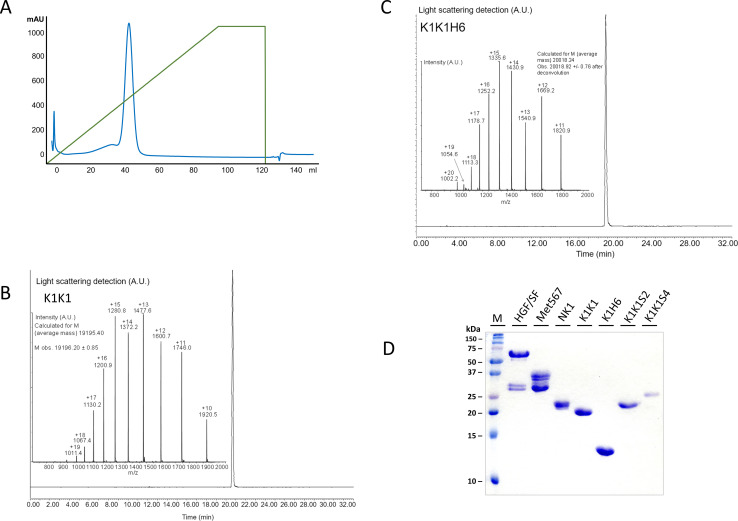
Figure S1. Purity of K1K1 after heparin sepharose affinity purification.
(A) Chromatography profile of the elution of K1K1 from the Heparin HiTrap column showing the 280 nm absorbance in blue and the gradient of eluent (1 M NaCl) in green. (B) UPLC/MS analysis of K1K1 after size exclusion chromatography showing estimated molecular mass nearly identical to the mass as predicted based on the amino acid sequence (19195.24 versus 19,207.69 D). (C) UPLC/MS analysis of K1K1H6 after size exclusion chromatography and showing estimated molecular mass nearly identical to the mass as predicted based on the amino acid sequence (20,018.24 versus 20,030.53 D). (D) Coomassie-stained SDS–PAGE gel showing the different recombinant proteins used in this study (see design in Fig 1B). About 5 μg of protein was loaded in reducing sample buffer in each lane.
Source data are available for this figure.

