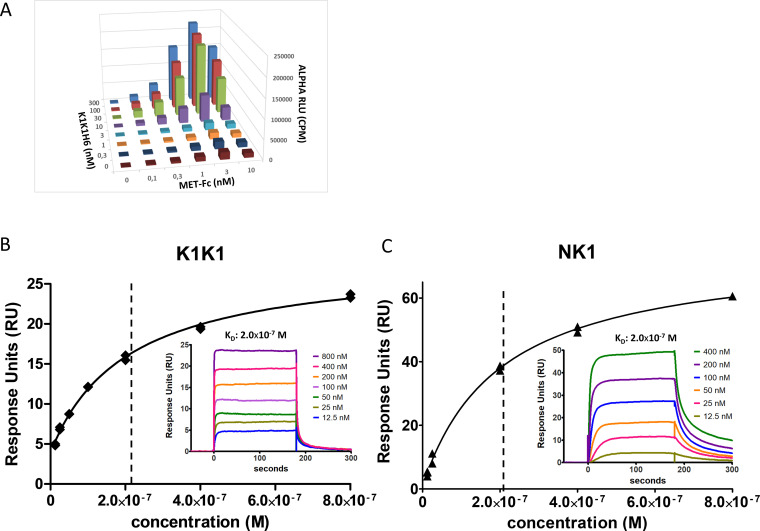
Figure S3. Characterization of K1K1H6 and K1K1 to MET by AlphaScreen and surface plasmon resonance (SPR) analysis.
(A) AlphaScreen cross titration assay using MET-Fc chimera (0–10 nM) and K1K1H6 (0–300 nM) dilutions was performed using protein A–coated Alpha acceptor beads with Ni-NTA–coated Alpha donor beads. The Alpha signal is expressed in CPS (photon counts per seconds). Measurements are expressed as technical duplicates (mean ± SD, n = 2). (B) SPR analysis of K1K1 to immobilized MET receptor extracellular domain. The main plot shows the binding isotherm with equilibrium response plotted at different concentrations. The inserted graph shows the binding curves at different concentrations of K1K1. (C) SPR analysis of NK1 to immobilized MET receptor extracellular domain. As in (B), the main plot shows the binding isotherm and the inserted graph shows the binding curves at different concentrations of NK1.
Source data are available for this figure.

