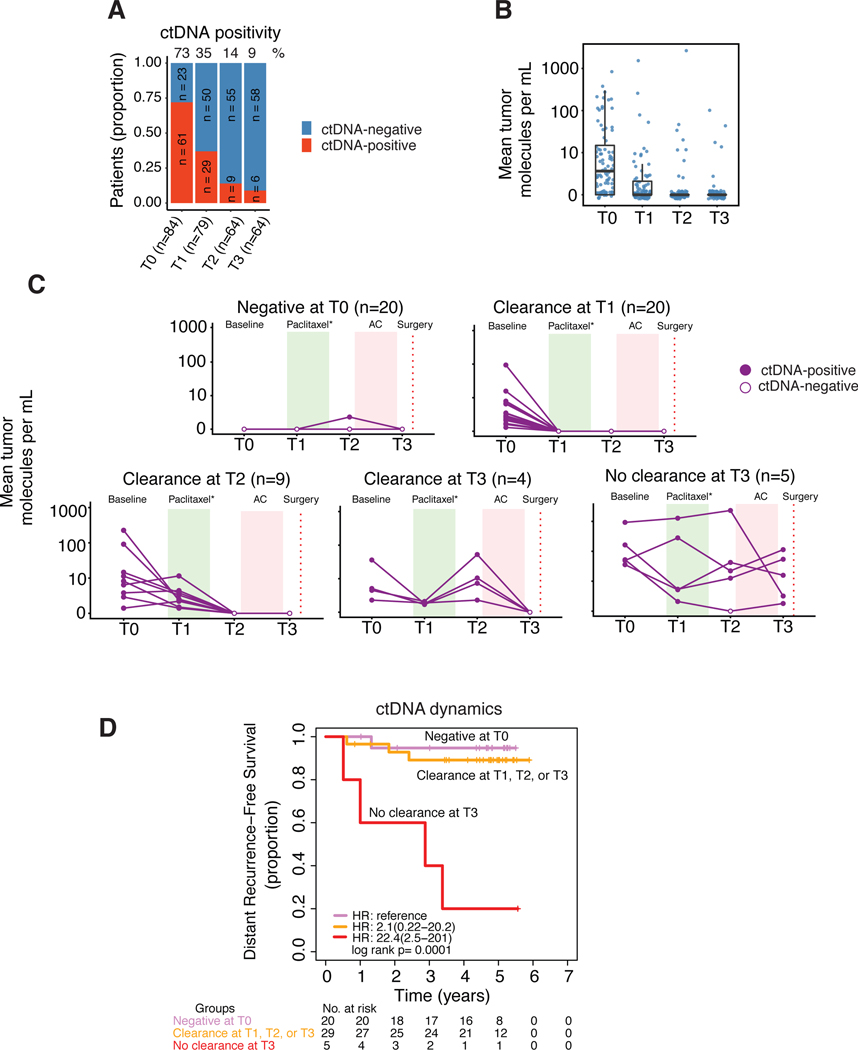
Fig 3. ctDNA dynamics over the course of neoadjuvant chemotherapy.
A) Proportion of patients according to ctDNA positivity based on number of samples available per time point. B) Mean tumor molecules per mL of plasma across time points. C) Patients with complete ctDNA data for four time points (n=58) grouped according to observed patterns of ctDNA clearance or non-clearance. D) Survival in patients grouped according to ctDNA clearance. Of the 58 patients, 54 had survival data. Patients who cleared ctDNA at T1, T2 or T3 were combined into one group and their survival was compared with those of patients who did not clear ctDNA at T3 and those who were ctDNA-negative at T0 (reference group).

