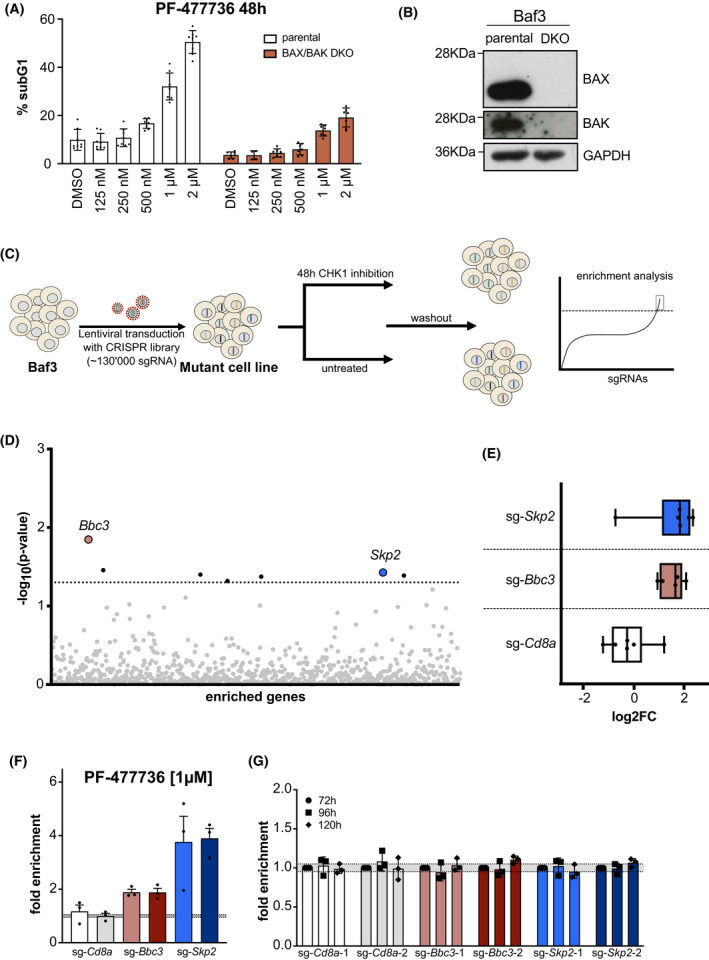
Fig. 1.

A CRISPR/Cas9 loss‐of‐function screen identifies SKP2 and PUMA/BBC3 as potential regulators of CHK1i‐induced cell death. (A) Parental and BAX/BAK double‐knockout (DKO) Baf3 cells were cultured for 48 h in different concentrations of the CHK1‐inhibitor, PF‐477736. Cell death was assessed using PI‐staining and flow cytometry. Each bar represents the mean of the respective concentration (±SD) of eight independent experiments (parental), seven independent experiments (BAX/BAK DKO; DMSO, 250 nm, 500 nm, 1 μm, and 2 μm) and four independent experiments for 125 nm. (B) Western blot confirming BAX/BAK double‐deficiency. A single experiment was performed. (C) Mutagenesis screen work‐flow: Murine Baf3Cas9 cells were transduced with the mouse GeCKO v2 library targeting each annotated gene with 4–6 individual sgRNAs. Upon in vitro expansion, cells were split and treated for 48 h with PF‐477726 or vehicle control (DMSO). After wash out, surviving cells were cultured for 2–3 weeks and genomic DNA was isolated for next‐generation Illumina sequencing. (D) NGS enrichment analysis. Each dot represents a single gene, which showed an enrichment in the library (either two or three sgRNAs) across all three independent biological replicates. The dotted line represents the significance level of 0.05. (E) Enrichment analysis of six independent sgRNAs targeting Bbc3/Puma and Skp2 compared to the Cd8a controls from three independent experiments. Data is depicted as box plots. Whiskers mark the highest and the lowest enriched sgRNAs. (F) For validation, Baf3Cas9 cells were transduced with virus encoding the sgRNA of interest and a dsRed marker gene (sg‐GOI/dsRed). sgRNAs targeting the Cd8a gene, not expressed in Baf3 cells were used as controls. Three days post transduction cells were treated with the CHK1 inhibitor PF‐477736 [300 nm] or DMSO for 48 h. The percentage of dsRed+ cells was assessed using flow cytometry, whereby the treatments were normalized to the DMSO‐treated controls and are shown as the ratio between (%dsRed+ treatment to %dsRed+ DMSO). Bars indicate the mean fold enrichment (±SEM) of three independent experiments. (G) Same procedure as in (F), but the sg‐GOI/dsRed transduced cells were monitored for enrichment over time without treatment. Bars indicate the mean fold enrichment (±SEM) of three independent experiments.
