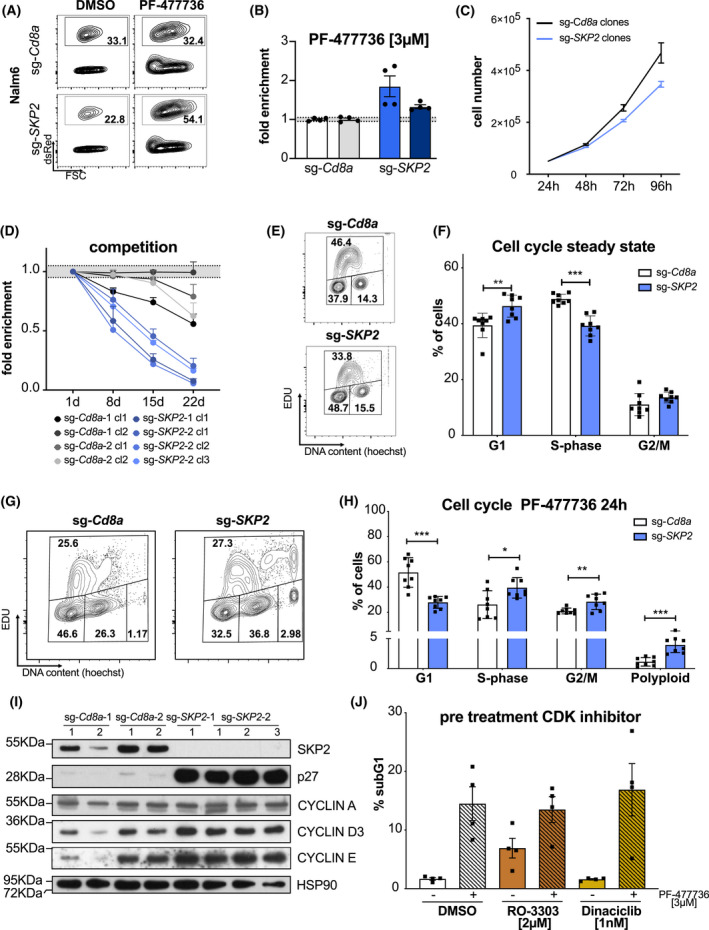
Fig. 6.

SKP2 expression tunes drug sensitivity to CHK1i in human cancer cells. Representative contour plots (A) and (B) quantification of Nalm6 human pre‐B acute lymphoblastic lymphoma cells transduced with two individual sg‐SKP2/dsRed or sg‐Cd8a/dsRed constructs, respectively. Three days post transduction the bulk cultures were treated with PF‐477736 [3 μm] or DMSO for 48 h. The percentage of dsRed+ cells was assessed using flow cytometry, whereby treated cells were normalized to DMSO controls. Bars indicate the mean percentage (±SEM) of four independent experiments. (C) Nalm6 SKP2 KO and sg‐Cd8a control clones were seeded at a concentration of 4 × 10⁴ cells per well. Cells were split 1 : 1 and counted every 24 h for a period of 4 days (±SEM). Experiment was performed using four independent clones. (D) Nalm6 SKP2‐KO (dsRed+) and sg‐Cd8a control clones (dsRed+) were mixed 1 : 1 ratio with Baf3Cas9 cells (parental cells, GFP+) and the percentage of dsRed+ and GFP+ cells was monitored over time using flow cytometry. Percentage of dsRed+ was normalized to percentage of dsRed+ on day 1. Points indicate the mean (±SEM) of three independent experiments per clone. (E) Representative contour plots of the cell cycle distribution (G1‐phase, S‐phase, G2/M) of Nalm6 SKP2 KO and sg‐Cd8a control clones in steady state were assessed via EdU incorporation for 1 h and subsequent staining, followed by flow cytometric analysis (EdU/DNA). Two independent experiments were performed. (F) Quantification of cell cycle profiles of Nalm6 SKP2‐KO and sg‐Cd8a control clones as shown in E. Bars indicate mean percentage (±SD) of four independent clones per genotype analyzed in two independent experiments. (G) Representative contour plots of the cell cycle distribution (G1‐phase, S‐phase, G2/M, polyploid) of Nalm6 SKP2 KO and sg‐Cd8a control clones after 24 h PF‐477736 [3 μm] treatment were assessed via EdU incorporation for 1 h and subsequent staining, followed by flow cytometry (EdU/DNA). Two independent experiments were performed. (H) Quantification of cell cycle profiles of PF‐477736 treated Nalm6 SKP2‐KO and sg‐Cd8a control clones as shown in G. Bars indicate the mean percentage (±SD) of four independent clones per genotype analyzed in two independent experiments. (I) Western blot showing SKP2, p27, CYCLIN A, CYCLIN D3, and CYCLIN E protein levels in Nalm6 SKP2‐KO and sg‐Cd8A control clones. A single experiment was performed. (J) Nalm6 parental cells were pre‐treated with RO‐3303, Dinaciclib, or DMSO for 8 h and then subsequently treated with PF‐477736 [3 μm] or DMSO plus RO‐3303, Dinaciclib, or DMSO for another 24 h. Cell death was assessed using PI staining and flow cytometry. Bars indicate the mean percentage (±SD) of four independent experiments. *P < 0.05; **P < 0.01; ***P < 0.001; unpaired t‐test.
