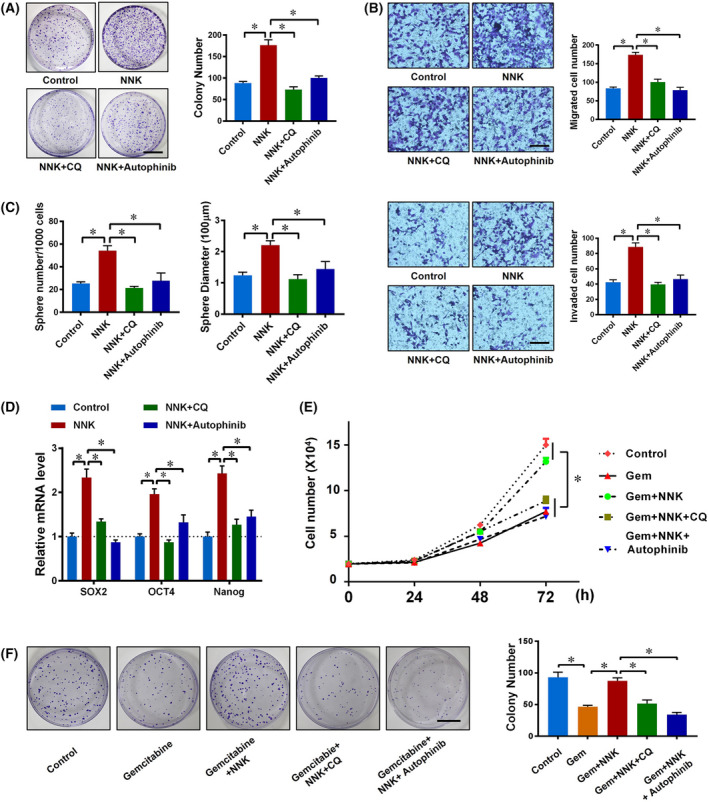
Fig. 3.

NNK enhances the stemness and chemoresistance of pancreatic cancer cells by activating autophagy. (A) Panc‐1 cells were divided into a control group, NNK (1 μm) group, NNK (1 μm) plus CQ (10 μm) group, and NNK (1 μm) plus Autophinib (10 μm) group. Cells were seeded in 6‐well plates and a cell colony formation assay was performed for 10 days. Representative images are shown (left) and the cell colony number was quantified (right; scale bar, 1 cm). Data are presented as mean ± SD of three separate experiments. *P < 0.05 by one‐way ANOVA test. (B) Panc‐1 cells were treated as in Fig. 3A. Transwell‐based migration (upper) and invasion (lower) assays were performed and quantified (scale bar, 100 μm). Data are presented as mean ± SD of three separate experiments. *P < 0.05 by one‐way ANOVA test. (C) Panc‐1 cells were treated as in Fig. 3A, then stem cell sphere formation assay was performed. Sphere number (left) and diameter (right) were quantified. Data are presented as mean ± SD of three separate experiments. *P < 0.05 by one‐way ANOVA test. (D) qRT‐PCR showing mRNA changes in Panc‐1 cells with indicated treatments for 24 h. Data are presented as mean ± SD of three separate experiments. *P < 0.05 by one‐way ANOVA test. (E) Panc‐1 cells were seeded in 12‐well plates and then received the indicated treatments; cell numbers were counted and analyzed. Data are presented as mean ± SD of three separate experiments. *P < 0.05 by one‐way ANOVA test. (F) 1000 pancreatic cancer cells were seeded in 6‐well plates with the indicated treatments; cell colony formation assay was performed for 10 days. Representative images are shown (left) and cell colony number was quantified (right) (scale bar, 1 cm). Data are presented as mean ± SD of three separate experiments. *P < 0.05 by one‐way ANOVA test.
