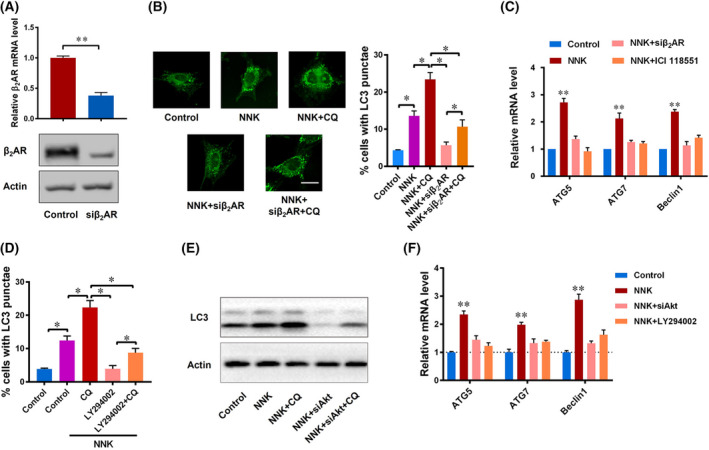
Fig. 4.

NNK promotes autophagy by modulating β2AR and Akt. (A) the mRNA (24 h) and protein (48 h) levels of β2‐adrenergic receptor (β2AR) were decreased by siRNA. Data are presented as mean ± SD of three separate experiments. **P < 0.01 by Student's t test. (B) Immunofluorescence staining (left) shows LC3 autophagy spots in the control group, NNK group, NNK plus siβ2AR group, NNK plus siβ2AR, and CQ group of Panc‐1 cells, and LC3 punctae was counted and analyzed (right) (scale bar, 15 μm). Data are presented as mean ± SD of three separate experiments. *P < 0.05 by one‐way ANOVA test. (C) The mRNA levels of ATG5, ATG7, and Beclin1 were determined in the control group, NNK group, NNK group, siβ2AR plus NNK group, and ICI118551 plus NNK group. Data are presented as mean ± SD of three separate experiments. **P < 0.01 compared with other groups by one‐way ANOVA test. (D) Panc‐1 cells were pretreated with LY294002 (10 μm) or CQ (10 μm), then received NNK (1 μm) treatment for 24 h. LC3 punctae was counted and analyzed by immunofluorescence microscopy. Data are presented as mean ± SD of three separate experiments. *P < 0.05 by one‐way ANOVA test. (E) Western blot to show LC3 protein change in each group of Panc‐1 cells 24 h after treatment. (F) qRT‐PCR showing mRNA changes in Panc‐1 cells 24 h after receiving the indicated treatments. Data are presented as mean ± SD of three separate experiments. **P < 0.01 compared with other groups by one‐way ANOVA test.
