Fig. 2.

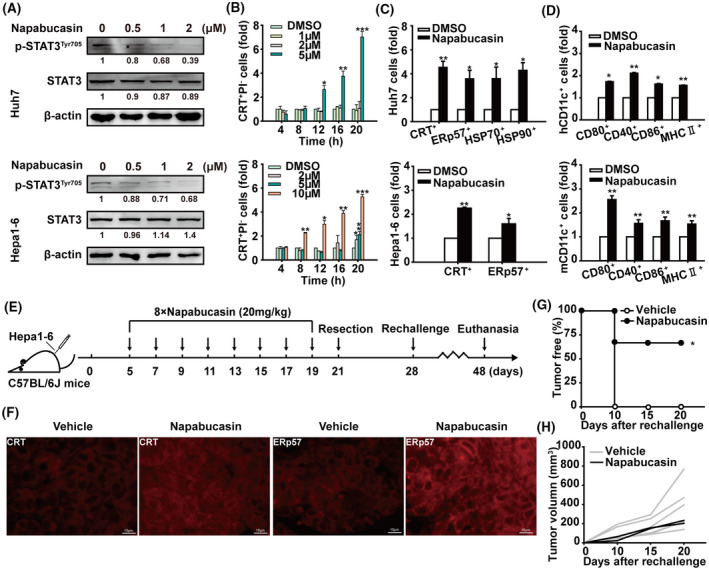
Targeting STAT3 induces immunogenic cell death of HCC in vivo. (A) Immunoblot showing STAT3 and p‐STAT3Tyr705 levels in Huh7 and Hepa1‐6 cells treated with different concentrations of napabucasin for 12 h (n = 3). Shown is one representative of at least three independent experiments. (B) After treatment with napabucasin or DMSO at the indicated concentrations and time, Huh7 and Hepa1‐6 cells were labelled with anti‐calreticulin antibody and PI and analysed by flow cytometry. (C) Flow cytometry analysis of calreticulin+, ERp57+, HSP70+, and HSP90+ cells in Huh7 and Hepa1‐6 cells treated with napabucasin or DMSO for 12 h. (D) Following coculture with Huh7 or Hepa1‐6 cells treated with napabucasin or DMSO for 48 h, CD80+, CD40+, CD86+, and MHC II+ cells in hDCs or mDCs were analysed by flow cytometry. Data are shown as mean ± SD from three independent experiments and were analysed with unpaired Student's t‐test or one‐way ANOVA (*P < 0.05, **P < 0.01, and ***P < 0.001). (E) The therapeutic schedule. C57BL/6J mice were inoculated with 5 × 10⁶ Hepa1‐6 cells in the left axilla. On day 5 postinoculation, mice were intraperitoneally injected with napabucasin (20 mg·kg–1) every 2 days for a total of eight injections. On day 2 after the last injection, the tumours were resected. On day 7 posttumour resection, these mice were inoculated subcutaneously with 5 × 10⁶ Hepa1‐6 cells in the right axilla. Solvent was used as vehicle. (F) The levels of calreticulin and ERp57 in tumour tissues were analysed by immunofluorescence. Scale bar = 10 μm. The tumour‐free rate (G) and tumour growth curve (H) of tumour‐rechallenged C57BL/6J mice are shown. Data represent the mean ± SD of n = 6 and tumour‐free analysis were analysed with the Chi‐squared test (*P < 0.05, **P < 0.01, and ***P < 0.001).
