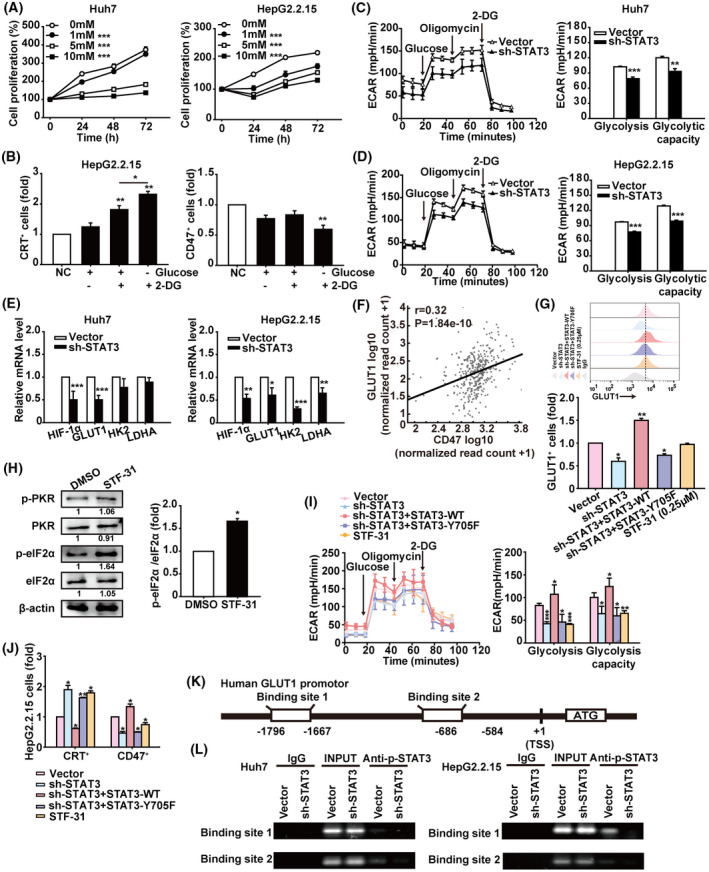
Fig. 5.

STAT3 regulates the glycolysis of HCC cells. (A) CCK‐8 assay of Huh7 and HepG2.2.15 cells treated with saline or the indicated concentrations of 2‐DG for 24, 48, and 72 h. (B) HepG2.2.15 cells were cultured in glucose‐free medium for 6 h to implement glucose starvation, then replaced with fresh medium containing glucose or/and 2‐DG for another 12 h. These cells were harvested for analysis of calreticulin and CD47 levels by flow cytometry. (C,D) Huh7 and HepG2.2.15 cells were infected with lentiviral STAT3‐shRNA vector or control vector for 48 h. The ECAR value was automatically recorded and calculated by the Seahorse XF‐24 analyser in Huh7 and HepG2.2.15 cells. (E) The mRNA levels of HIF1α, GLUT1, HK2, and LDHA in Huh7 and HepG2.2.15 cells infected with lentiviral STAT3‐shRNA vector or control vector were analysed by qRT‐PCR. Data were normalised to β‐actin and are shown as mean ± SD from three independent experiments. Data are shown as mean ± SD from three independent experiments and were analysed with unpaired Student's t‐test or one‐way ANOVA (*P < 0.05, **P < 0.01, and ***P < 0.001). (F) AIPuFu database analysis of the correlation between GLUT1 and CD47 in HCC from the TCGA database. Correlations were determined by Pearson analysis. (G) Flow cytometry analysis of GLUT1+ cells in HepG2.2.15 cells treated as indicated. (H) Western blot analysis of PKR, p‐PKRThr446, eIF2α, and p‐eIF2αSer51 expression in HepG2.2.15 cells treated with STF‐31 (0.25 μm) for 12 h. The grey scale of protein bands was quantified by imagej (National Institutes of Health, Bethesda, MD, USA). Data are shown as mean ± SD from three independent experiments and were analysed with unpaired Student's t‐test (*P < 0.05). (I) The ECAR value of HepG2.2.15 cells treated as indicated. The statistical results of glycolysis and glycolysis capacity are shown. Data are shown as mean ± SD from three independent experiments and were analysed with one‐way ANOVA (*P < 0.05, **P < 0.01, and ***P < 0.001). (J) Analysis of calreticulin+ and CD47+ cells in HepG2.2.15 cells treated as indicated by flow cytometry. Data are shown as mean ± SD from three independent experiments and were analysed with one‐way ANOVA (*P < 0.05 and **P < 0.01). (K) Schematic representation shows two candidate STAT3 binding sites on human GLUT1 gene promoter. (L) ChIP assays were performed to evaluate binding of STAT3 to the GLUT1 promoter in HCC cells. Human anti‐STAT3 antibody or control human IgG was used for immunoprecipitation with DNA from Huh7 and HepG2.2.15 cells. The immunoprecipitates were then amplified by PCR using primers targeting GLUT1. Shown is one representative of at least three independent experiments.
