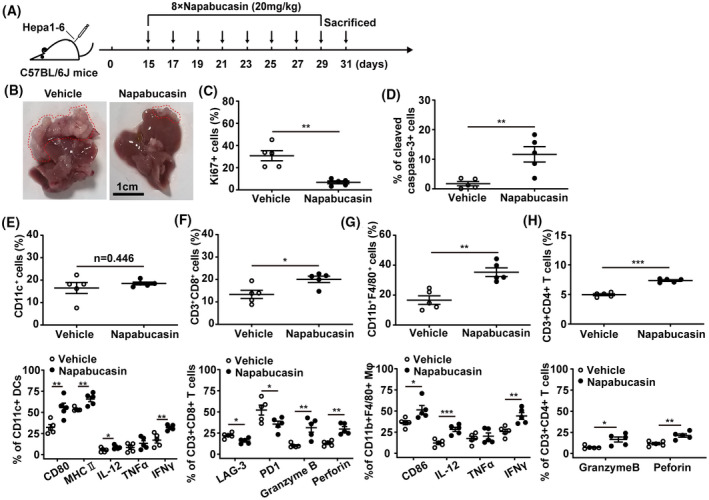
Fig. 6.

Napabucasin triggers the antitumour immune response in the orthotopic mouse model of HCC. C57BL/6J mice were inoculated with 2 × 10⁶ Hepa1‐6 cells in the left lobe of the liver. On day 15 postinoculation, mice were intraperitoneally injected with napabucasin (20 mg·kg–1) every 2 days for a total of eight injections. Solvent was used as vehicle. Liver cells and mononuclear cells were isolated and analysed by flow cytometry. (A) The therapeutic schedule. (B) The liver from orthotopic liver transplantation mice, and the red line shows grafts after growth. Scale bar = 1 cm. The frequency of Ki67+ (C) and cleaved caspase‐3+ cells (D) in livers was assessed by flow cytometry. (E) The proportion of CD11c+ DCs (up), CD80+, MHC II+, IL‐12+, IFNγ+ and TNFα+ DCs (bottom) DCs infiltrated in liver was analysed by flow cytometry. (F) The proportion of CD3+CD8+ T cells (up), LAG‐3+, PD1+, Granzyme B+ and Perforin+ CD8+ T cells (bottom) in liver was analysed by flow cytometry. (G) The frequency of CD11b+F4/80+ macrophages (up) and CD86+, IL‐12+, IFNγ+ and TNFα+ macrophages in liver was assessed by flow cytometry. (H) The proportion of CD3+CD4+ T cells (up), and Granzyme B+ and Perforin+ CD4+ T cells (bottom) was analysed by flow cytometry. Mφ, macrophage. Data represent the mean ± SD of n = 5 and were analysed with one‐way ANOVA (*P < 0.05, **P < 0.01, and ***P < 0.001).
