
Fig. 2 |. Functional analysis of rare (<0.1% frequency in 1000G) tandem repeat expansions.
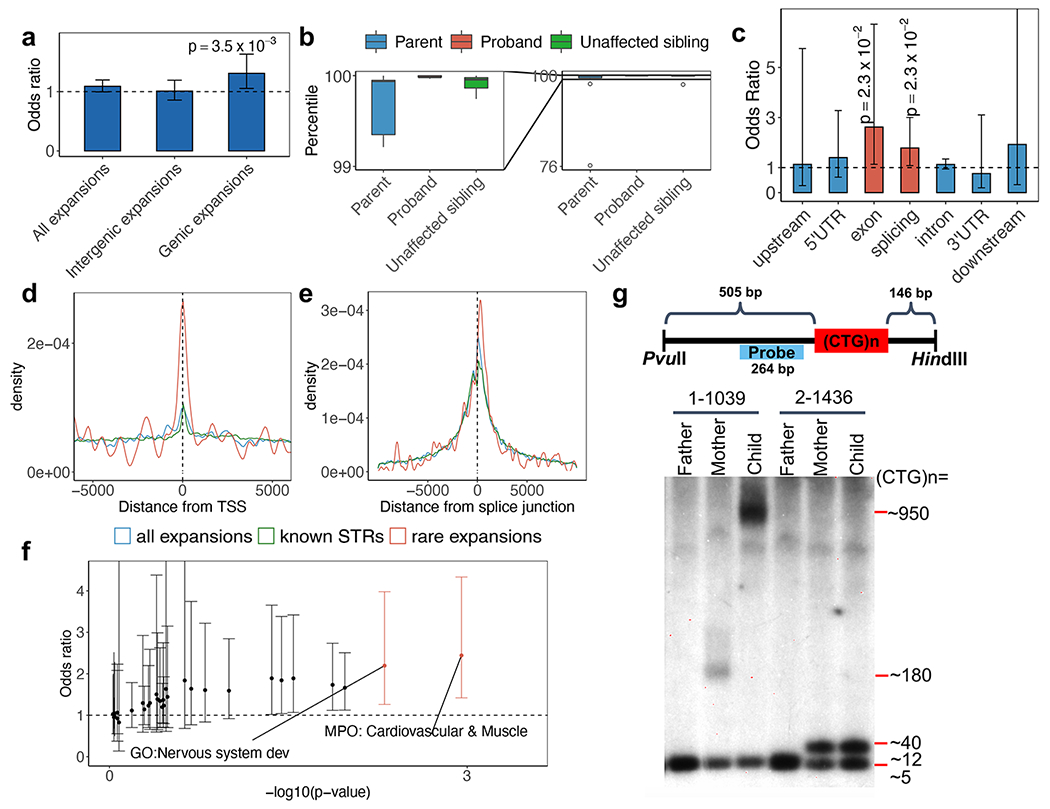
a, Burden comparison of all rare expansions, intergenic rare expansions, and genic rare expansions. Odds ratio is for ASD-affected individuals (N=1,812) compared with their unaffected siblings (N=1,485). The trend for genic expansions is preserved regardless of the frequency threshold used to define a tandem repeat expansion as rare in population controls (Supplementary Table 10). b, Repeat size distribution in probands, their parents, and their unaffected siblings, where the probands have rare tandem repeat expansions (N=10 families). The diagram on the left shows a zoomed-in view of the repeat-size distribution between the 99th and 100th percentile. The minima and maxima indicate 3×inter-quartile range-deviated tandem repeat size from the median, and the centre indicates the median of the tandem repeat size. c, Rare tandem repeat expansion burden in different genomic features. Red bars indicate significant enrichment in ASD-affected individuals (family-wise error rate; FWER < 20%). The horizontal dashed line represents odds ratio=1. An ANOVA test comparing two logistic regression models was used to obtain the results in b and c. d-e, Distance of rare tandem repeat expansions (all individuals), all tandem repeats detected, and known simple sequence repeats to the nearest transcription start site (TSS) (d) and the nearest splice junction (e). Rare tandem repeat expansions (N=258 loci close to TSS and N=297 loci close to splice junctions) are significantly closer to TSS (Wilcoxon test, p=0.01 and 0.003 for all tandem repeats detected (N=5,805 loci) and known simple sequence repeats (N=133,264 loci), respectively) and splice junctions (Wilcoxon test, p=0.03 and 0.002 for all tandem repeats detected (N=7,279 loci) and known simple sequence repeats (N=161,932 loci), respectively). f, Gene set burden analysis of number of rare tandem repeat expansions affecting genes in a gene set comparing ASD-affected individuals (N=1,812) with their unaffected siblings (N=1,485). Orange points indicate odds ratios of gene-sets with FWER < 20%. g, Schematic diagram (top) shows the design of a Southern blotting experiment in the targeted tandem repeat in DMPK. Two families with different repeat sizes (1-1039 with expansions and 2-1436 without expansions) are shown. Repeat length validation experiments for DMPK were consistently reproduced at least 3 to 5 times (see Supplementary Figure 8). Error bars in a, c and f indicate 95% confidence intervals.