
Extended Data Figure 2 |. Distribution of the number of tandem repeats detected by ExpansionHunter Denovo.
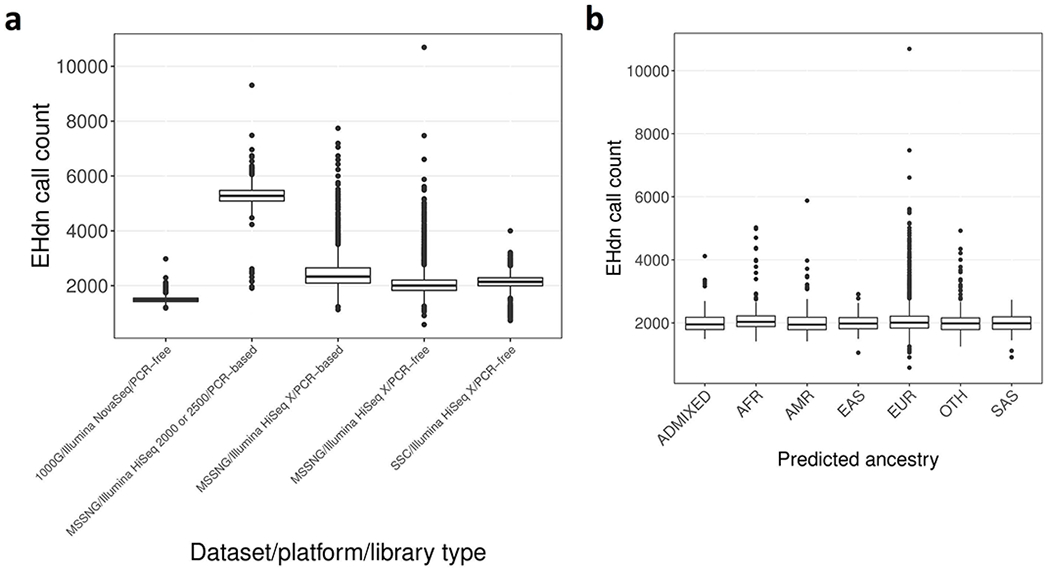
The number of tandem repeats detected by ExpansionHunter Denovo in a given sample is stratified by: a, cohort, sequencing platform, and DNA library preparation method (N=2,504, 594, 1,220, 6,634, and 9,096 for 1000G/Illumina NovaSeq/PCR-free, MSSNG/Illumina HiSeq 2000 or 2500/PCR-based, MSSNG/Illumina HiSeq X/PCR-based, MSSNG/Illumina HiSeq X/PCR-free, and SSC/Illumina HiSeq X/PCR-free, respectively), and b, predicted ancestry for samples in the “MSSNG/Illumina HiSeq X/PCR-free” category (N=157, 301, 247, 287, 4,841, 687, and 114 for ADMIXED, AFR, AMR, EAS, EUR, OTH, and SAS, respectively). Ancestry designations were derived from the 1000 Genomes “super populations” (https://www.internationalgenome.org/category/population): AFR, African; AMR, Admixed American; EAS, East Asian; EUR, European; OTH, other; SAS, South Asian. The centre of each boxplot indicates the median, the lower and upper hinges correspond to the first and third quartiles, and the minima and maxima are 1.5× the inter-quartile range below or above the median, respectively.