
Extended Data Figure 3 |. Tandem repeat detection quality control.
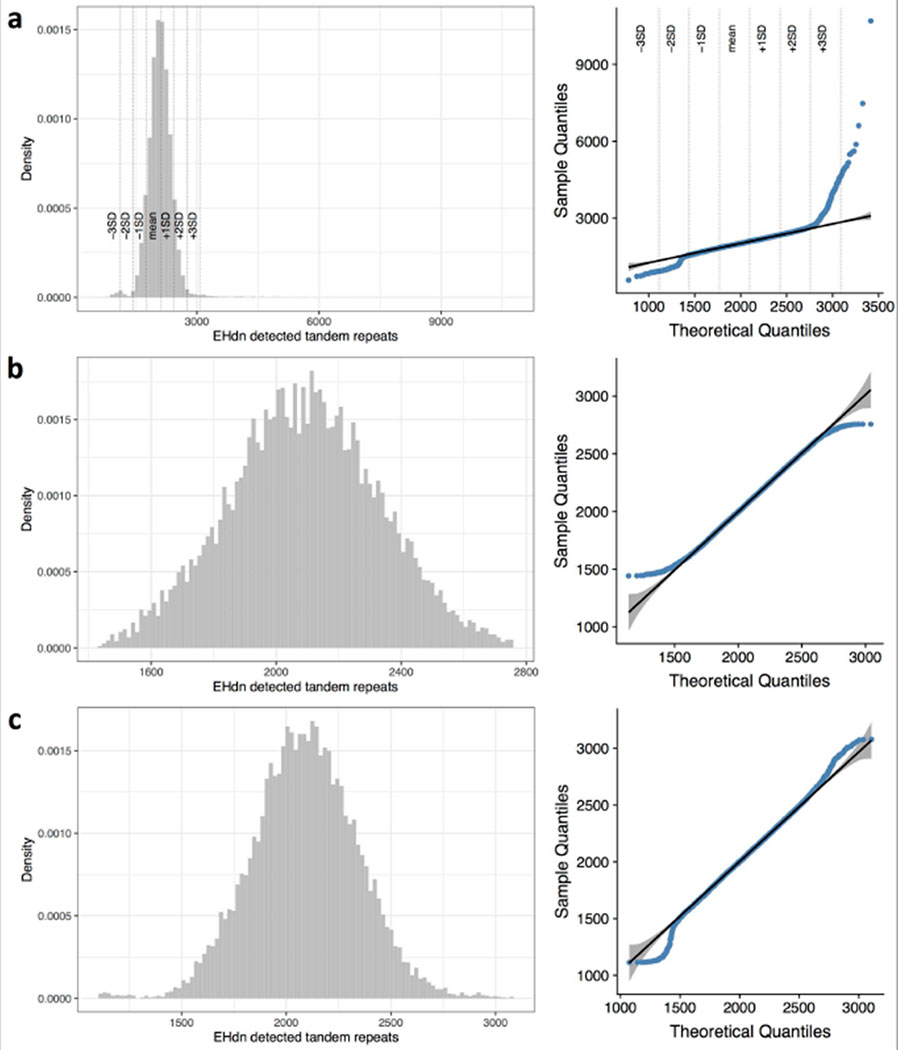
Histogram and normal QQ-plot of the number of tandem repeats detected by ExpansionHunter Denovo for a, all samples, b, samples for which the number of tandem repeats was within mean ± 2*SD, and c, samples for which the number of tandem repeats was within mean ± 3*SD. Of the 3 distributions, c is closest to the normal distribution.