
Extended Data Figure 5 |. Distributions of GnomAD gene constraints.
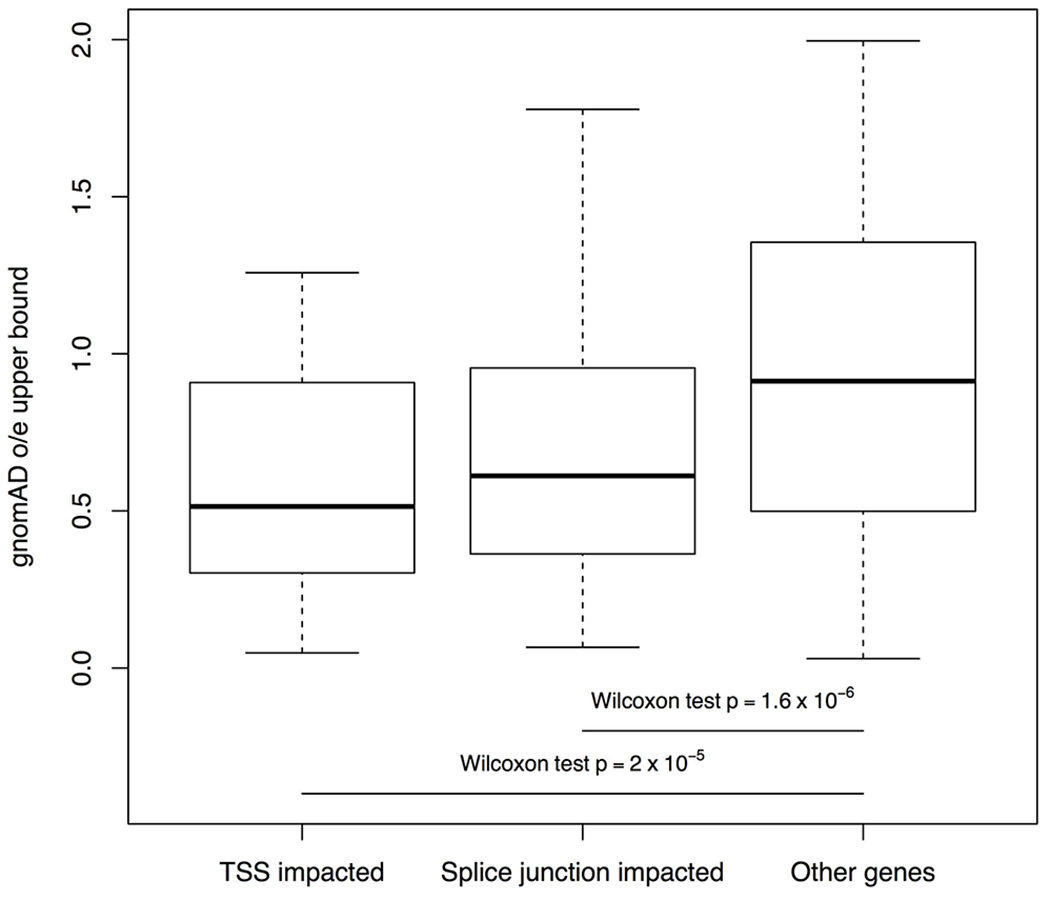
The distributions of GnomAD observed/expected (o/e) upper bounds are shown for genes with rare tandem repeat expansions near transcription start sites (TSS, N=32 genes) and splice junctions (N=80 genes), compared to other genes (N=19,567 genes) (one-sided Wilcoxon rank sum test). The minima and maxima indicate 3×inter-quartile range-deviated o/e upper bounds from the median, and the centre indicates the median of the o/e upper bounds.