
Extended Data Figure 6 |. Transmission tests.
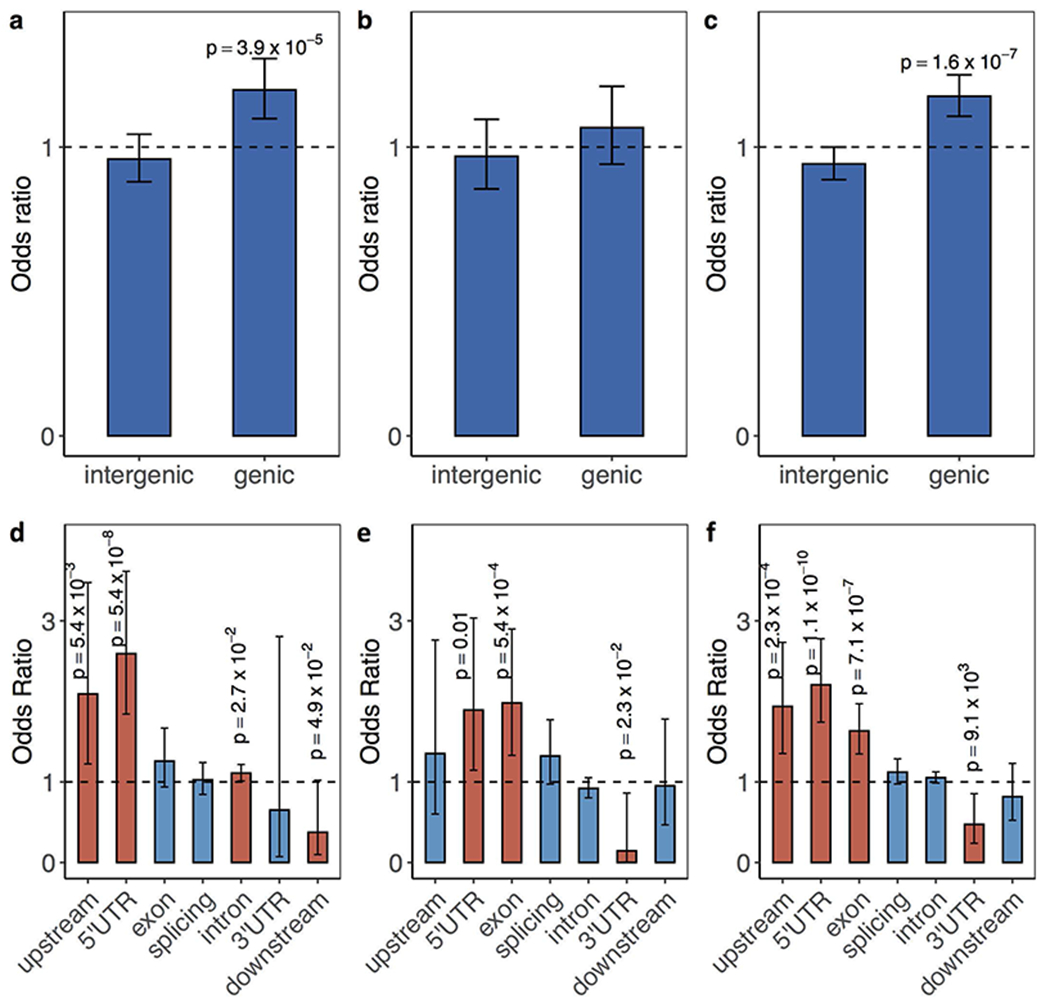
a-c, Odds ratios calculated as ratios of the transmission events of genic large tandem repeats and those in intergenic regions. Only affected individuals with European ancestry in a, SSC (N=1,808), b, MSSNG (N=2,010) and c, both SSC and MSSNG (N=3,818) were considered. d-f, Odds ratios calculated as ratios of the transmission events of large tandem repeats (99th percentile of length distribution) in a particular functional element to those in intergenic regions. Only affected individuals of European ancestry in d, SSC, e, MSSNG and f, both SSC and MSSNG were considered. Fisher’s exact test was applied to estimate the odds ratios and 95% confidence intervals indicated by error bars.