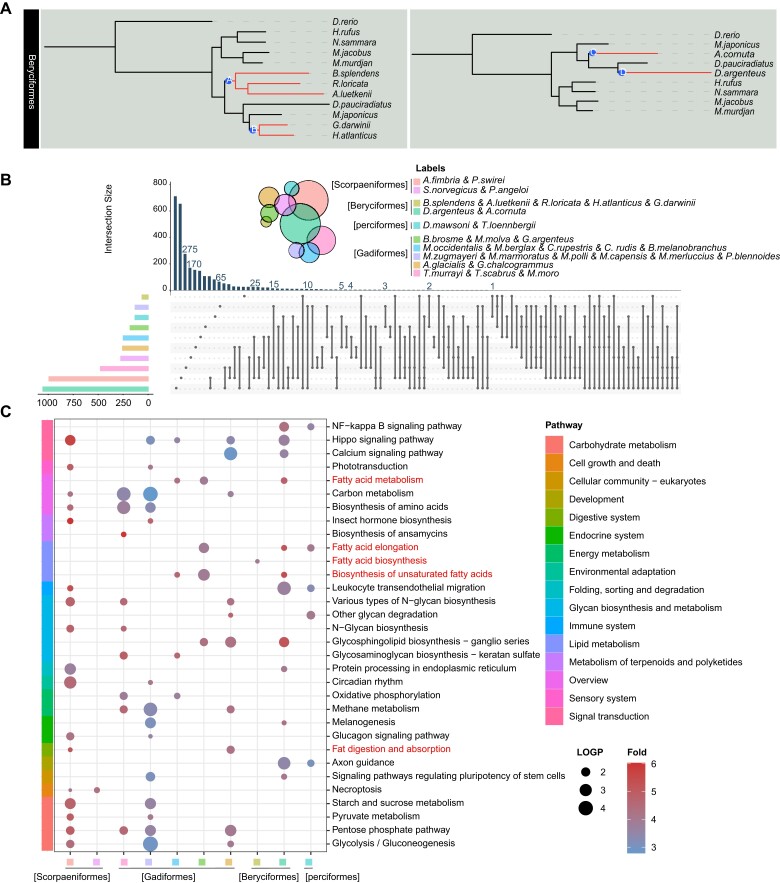
Fig. 4.
Results of convergent evolutionary analysis were presented. (A) Using Beryciformes as an example, the A, B and C, D branches were labeled, and the gene convergence of the two branches was calculated. (B) Statistics of convergent genes per two branches. The left bar graph shows the number of convergence genes in each two branches, and the upper bar graph shows the number of statistical units, which are illustrated by dots and lines. (C) In the KEGG functional enrichment pathway diagram of convergence genes, the bubble size represents -log10P-value, and the color represents enrichment fold, which is the ratio of the probability of actual enrichment to the probability of random enrichment. See supplementary table 4 for abbreviations of species names.

