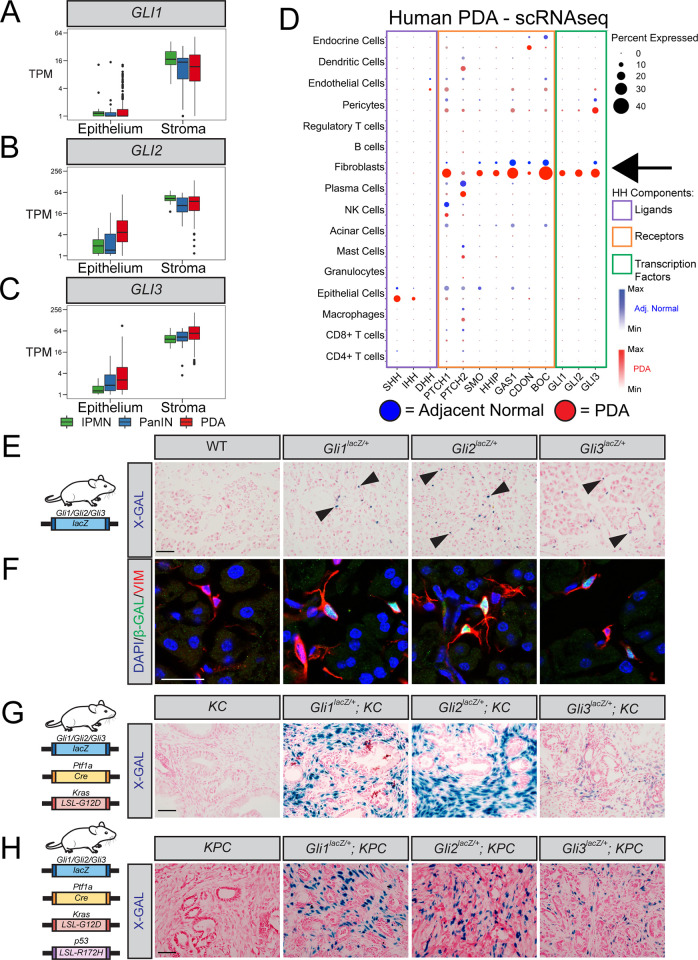
Fig 1. Gli1-3 are expressed in the pancreatic stroma and expand during PDA progression.
(A–C). Epithelial vs. Stromal GLI expression in human IPMN tissue (green, n = 19 Epithelial, n = 12 Stromal), PanIN (blue, n = 26 Epithelial, n = 23 Stromal), and PDA (red, n = 197 Epithelial, n = 124 Stromal), determined by LCM-RNAseq [40]. (D) Expression of HH pathway components in human PDA (red, n = 16) and adjacent normal pancreas (blue, n = 3), determined by scRNAseq [42]. Dot size indicates frequency. Dot color intensity indicates expression level. Boxes outline ligands (purple), receptors (orange), and transcription factors (green). Arrow indicates GLI expression in fibroblasts. (E–H) Expression analysis of healthy (E-F), PanIN (G), and PDA (H) pancreata from GlilacZ reporter mice (n ≥ 3 for all genotypes). X-gal staining (E, G, H) in blue. Arrowheads indicate lacZ+ cells. Scale bar = 50μm. For immunofluorescent antibody analysis of healthy pancreata (F), antibodies detect β-Galactosidase (β-GAL, green) and fibroblasts (VIM, Red). DAPI (blue) denotes nuclei. Scale bar = 20 μm. Mouse drawing acquired from the open source repository SciDraw.io (doi.org/10.5281/zenodo.3925901).

