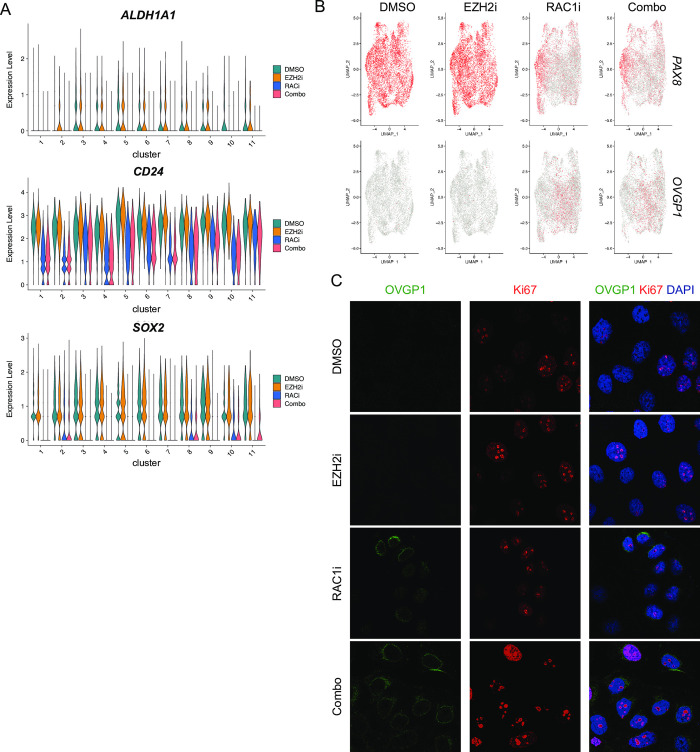
Fig 5. RAC1 inhibition reduces stem cell marker expression in most clusters.
(A) Violin plots of expression levels of indicated genes in the different clusters and sample types. (B) UMAP dot plots of normalized gene expression values in the indicated sample types. (C) Representative immunofluorescence images of OVGP1 (green) and Ki67 (red) staining after DMSO, EZH2i (5 μM, 48H), RAC1i (50 μM, 48H), or Combo (RAC1i + EZH2i) treatment. N = 3.

