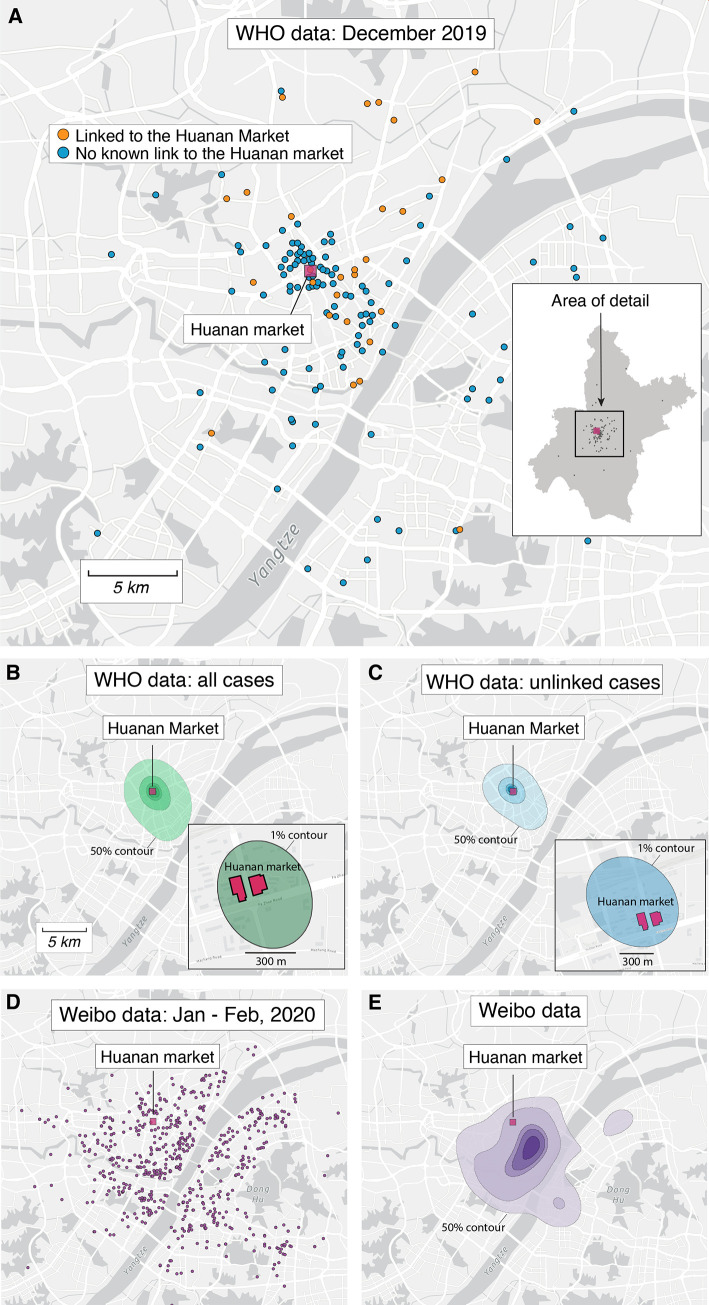
Fig. 1. Spatial patterns of COVID-19 cases in Wuhan in December 2019 and January-February 2020.
(A) Locations of the 155 cases we extracted from the WHO mission report ( 7 ). Inset: map of Wuhan with December 2019 case indicated with gray dots. (No cases are obscured by the inset.) In both the inset and the main panel the location of the Huanan market is indicated with a red square. (B) Probability density contours reconstructed by a kernel density estimate (KDE) using all 155 COVID-19 cases locations from December 2019. The highest density 50% contour marked is the area for which cases drawn from the probability distribution are as likely to lie inside as outside. Also shown are the highest density 25%, 10%, 5%, and 1% contours. Inset showing an expanded view and the highest density 1% probability density contour. (C) Probability density contours reconstructed using the 120 COVID-19 cases locations from December 2019 that were unlinked to the Huanan market. (D) Locations of 737 COVID-19 cases from Weibo data dating to January and February of 2020. (E) The same highest probability density contours (50% through 1%) for 737 COVID-19 case locations from Weibo data.

