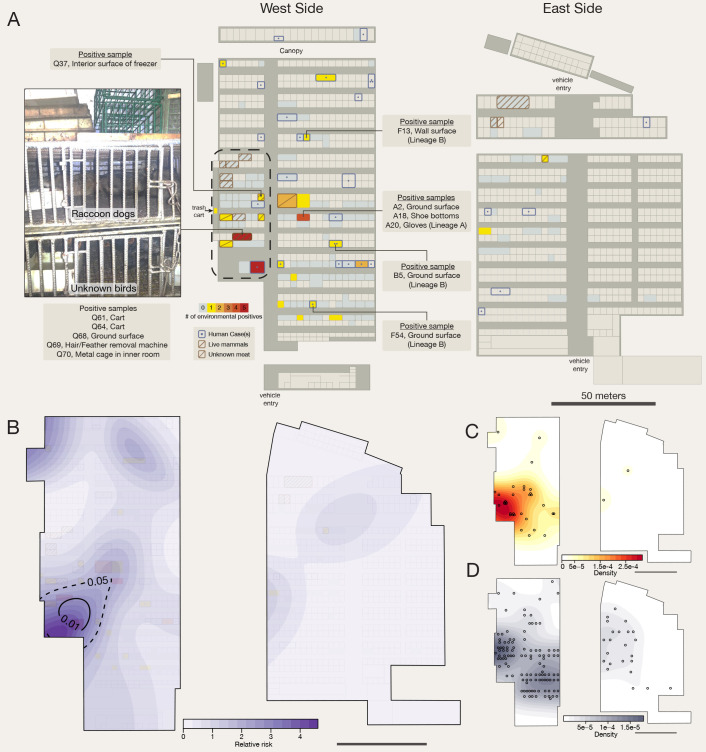
Fig. 4. Map of the Huanan Wholesale Seafood Market.
(A) Aggregated environmental sampling and human case data from Huanan Market. Captions (left) describe the types of SARS-CoV-2 positive environmental samples obtained from known live animal vendors and (center) from stalls with samples with known virus lineage. Lineage is unknown unless noted; sequencing data has not been released for some samples and many samples were PCR-positive but not sequenced. Image (left) of raccoon dogs in a metal cage, on top of caged birds, taken in business with five positive environmental samples (photo credit: E.C.H.). Rectangle with dashed outline is used to denote the ‘wildlife’ section of the market. (B) Relative risk analysis of positive environmental samples. Tolerance contours enclose regions with statistically significant elevation in density of positive environmental samples relative to the distribution of sampled stalls. (C) Distribution of positive environmental samples. Sample locations (centroid of corresponding business) and quantity are shown as black circles. (D) Control distribution for relative risk analysis. All businesses investigated with environmental sampling are shown as black circles (one per business, whether or not a positive sample was found). See table S12 for details on stalls that were SARS-CoV-2-negative.

