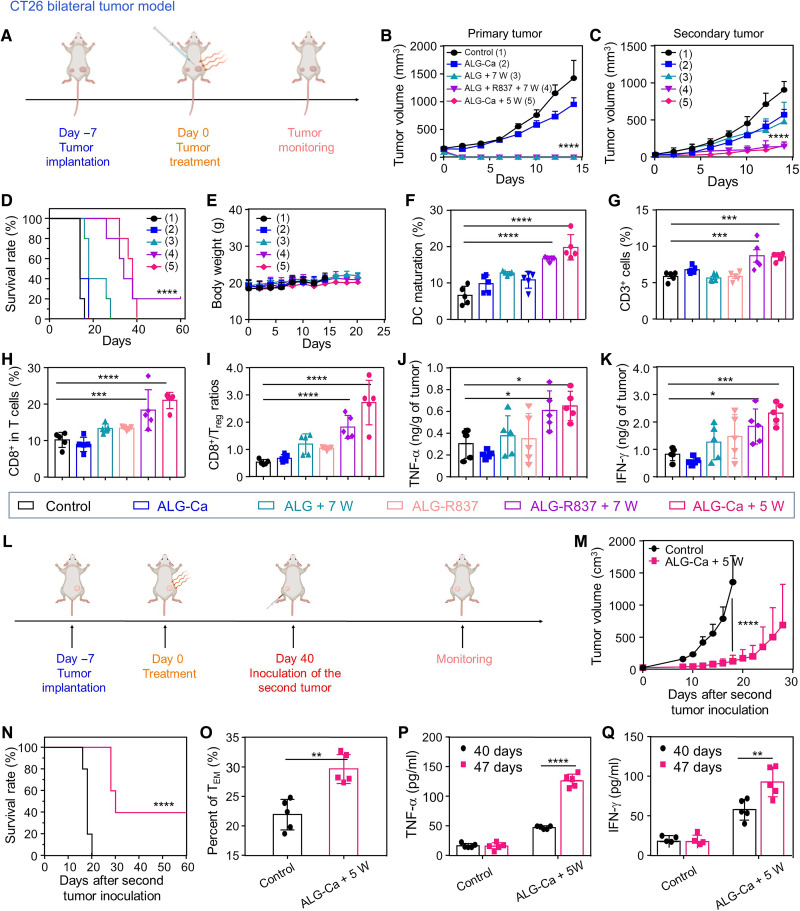
Fig. 5. ALG-Ca–assisted MWA treatment in eliciting antitumor immunity.
(A) Schematic illustration of the utilization of bilateral CT26 tumor model for in vivo antitumor treatment. (B to E) Tumor growth curves of primary (B) and distant tumors (C), as well as corresponding mobility-free survival rate (D) and body weights (E) of mice with their large tumors after different treatments as indicated (n = 5). The mouse was set as death when its tumor volume was large than 1000 mm3. (1), (2), (3), (4), (5) represent Control, ALG-Ca, ALG+7W, ALG+R837+7W and ALG-Ca+5W, respectively. (F) DC maturation status in the drain lymph nodes adjacent to the primary tumors post various treatments as indicated. (G to I) The frequencies of CD3+ cells (G), CD3+CD8+ T cells (H), and the ratios of CD3+CD8+ T cells to corresponding regulatory T cells (Tregs) inside the distant tumors after various treatments as indicated. (J and K) The secretion levels of tumor necrosis factor–α (TNF-α) (J) and IFN-γ (K) inside the distant tumors after various treatments as indicated. (L) Schematic illustration of the tumor rechallenge assay. (M and N) Tumor growth curves (M) and mobility-free survival rate (N) of mice after various treatments as indicated (n = 5). (O) Proportions of effector T memory (TEM) analyzed by flow cytometry at day 40, right before rechallenging mice with secondary tumors. (P and Q) Cytokine levels including TNF-α (P) and IFN-γ (Q) in sera from mice isolated right before and 7 days after mice were rechallenged with secondary tumors. Data were represented as means ± SEM (n = 5 biologically independent animals). P values in (B) to (D) and (M) to (Q) were calculated by using unpaired t test (*P < 0.05, **P < 0.01, and ***P < 0.001). P values in (F) to (K) were calculated by using one-way ANOVA (*P < 0.05, **P < 0.01, ***P < 0.001, and ****P < 0.0001).

