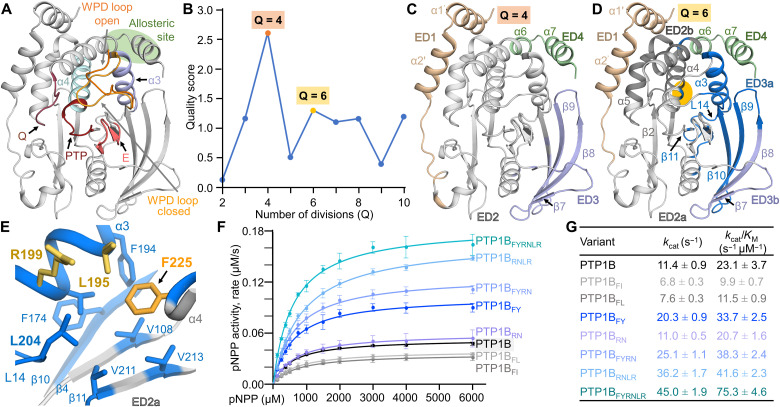
Fig. 1. Coevolutionary coupling analysis identifies a conserved domain that influences PTP1B activity.
(A) Overlay of the open [Protein Data Bank (PDB): 5K9V; WPD loop only) and closed (PDB: 5K9W; gray cartoon) states of PTP1B. Highlighted functional elements include the PTP and Q loops (red), the WPD loops (closed, light orange; open, orange), the E loop (pink), helix α3 (lavender) and helix α4 (light blue), and the allosteric pocket (green circle). (B) Evolutionary partitioning (quality score versus Q divisions) identifying groups of coevolving residues (ED) in PTP1B using multiple sequence aålignments (MSA). (C) PTP1B EDs identified for Q = 4: ED1, N terminus (beige); ED2, core PTP domain (gray); ED3, β strands 7 to 10 (lavender); ED4, allosteric pocket (green). (D) PTP1B EDs identified for Q = 6: ED1 and ED4 same as in (C); ED2a, key catalytic loops (light gray); ED2b, support helices α4/α5 and part of helix α6 (dark gray); ED3a, β strands β9/β10 (with parts of β4 and β8) that are now grouped with helix α3 and loop L14 (blue); ED3b, the remainder of β strands β8 and β7 (lavender). Orange circle highlights the position of F225 on helix α4, which is part of ED3b. (E) ED3a hydrophobic pocket centered on F225. (F) Catalytic activity of ED3a variants (n = 3 to 4). (G) Kinetic parameters for measurements in (F).

