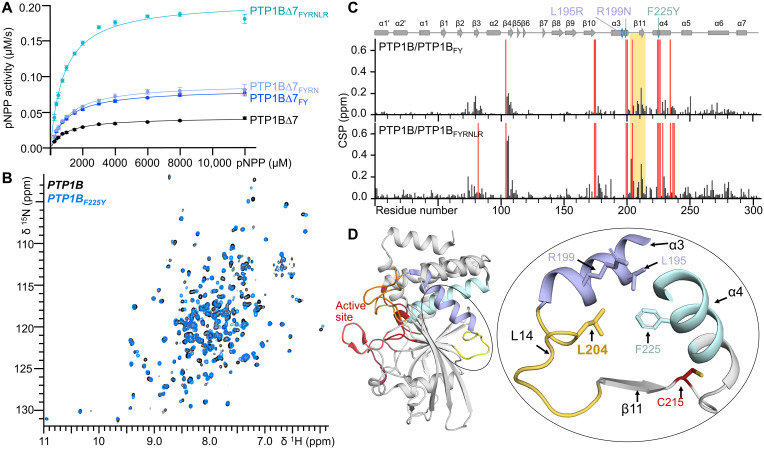
Fig. 2. Modulation of PTP1B activity by ED3a.
(A) Catalytic activity for PTP1B∆7 variants (n = 3 to 4). (B) Overlay of the 2D [1H,15N] TROSY spectrum of PTP1B (black) and PTP1BF225Y (blue). (C) CSPs of PTP1B versus PTP1BF225Y (top) or PTP1BF225Y-R199N-L195R (bottom). Red bars indicate peaks that broadened beyond detection; PTP1B secondary structural elements are shown, and the location of mutations is indicated by a diamond. (D) Loop L14 and L204 and its relationship to ED3a (residues F225, L195, and R199) and the active site PTP loop (C215). Structural elements are colored as in Fig. 1A. ppm, parts per million.

