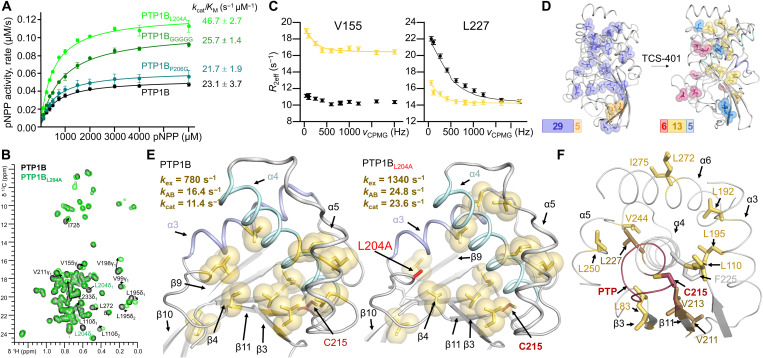
Fig. 3. Group 2 dynamics are related to enzyme catalysis.
(A) Catalytic activity for PTP1B L14 variants (n = 3 to 4). (B) Overlay of 13C ILV 2D [1H,13C] HSQC spectrum of PTP1B (black) and PTP1BL204A (green). Moving peaks are annotated and indicated with arrows. (C) Representative 13C-CPMG dispersion profiles for V155 [fast exchange in free PTP1BL204A (black) and intermediate exchange in TCS401-saturated PTP1BL204A (yellow)] and L227 [free PTP1BL204A (black) and intermediate exchange in TCS401-saturated PTP1BL204A (yellow)]. (D) Left: ct-CPMG relaxation dispersion grouping for PTP1BL204A (PDB 7MNC), group 1 (kex = 3000 ± 40 s−1; dark blue) and group 2 (kex = 5000 ± 210 s−1; orange). Right: ct-CPMG dispersion relaxation grouping for PTP1BL204A saturated with TCS401 (PDB 7MND), group 1 (kex = 3130 ± 280 s−1; blue), group 2 (kex = 1340 ± 120 s−1; yellow), and group 3 (kex = 680 ± 40 s−1; raspberry). (E) ct-CPMG dispersion relaxation group 2 in TCS401-saturated PTP1B (left) (24) and TCS401-saturated PTP1BL204A (right). The exchange frequency (kex) and kAB, along with the measured kcat, for TCS401-saturated PTP1B and PTP1BL204A are shown. (F) Group 2 residues (yellow sticks) cradle helix α4 (residues that anchor the PTP loop are shown in dark yellow). The PTP loop, including the catalytic C215, is shown in red.

