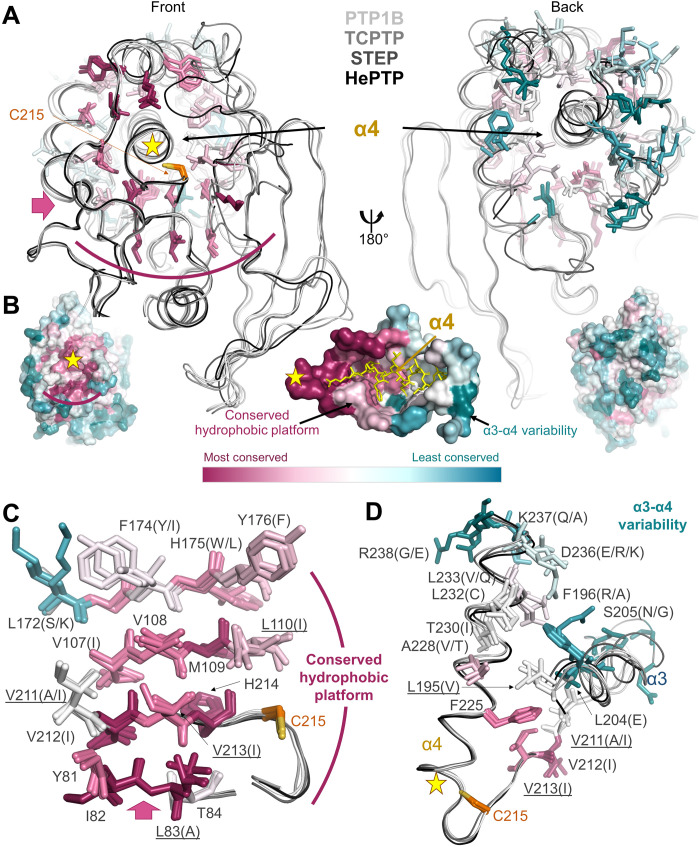
Fig. 4. Group 2 residues are highly conserved.
(A) Overlay of PTP1B (white), TCPTP (light gray), STEP (dark gray), and HePTP (black). Residues surrounding helix α4 are shown as sticks and colored by conservation within the PTP family. Left: Front view looking down helix 4 from the active site (yellow star; catalytic Cys shown in orange sticks). Pink arrow indicates the view of the hydrophobic platform (curved magenta line) shown in (B). Right: Same overlay rotated by 180°. (B) PTP1B is shown as a surface and colored according to PTP family sequence conservation [most conserved (magenta) and least conserved (teal)]. Left: Same orientation as in (A), left. Right: Same orientation as in (A), right. Middle: View of helix α4 looking down illustrating the conserved hydrophobic platform and the increased variability at the α3-α4 junction. (C) Residues (shown as sticks) that comprise the conserved hydrophobic platform that support helix α4 are colored according to conservation and labeled (underline indicates a group 2 residue). (D) Residues (shown as sticks) illustrating the increased variability at the C-terminal portion of helix α4 adjacent to the N terminus of helix α3. Residues are colored and labeled as in (C).

