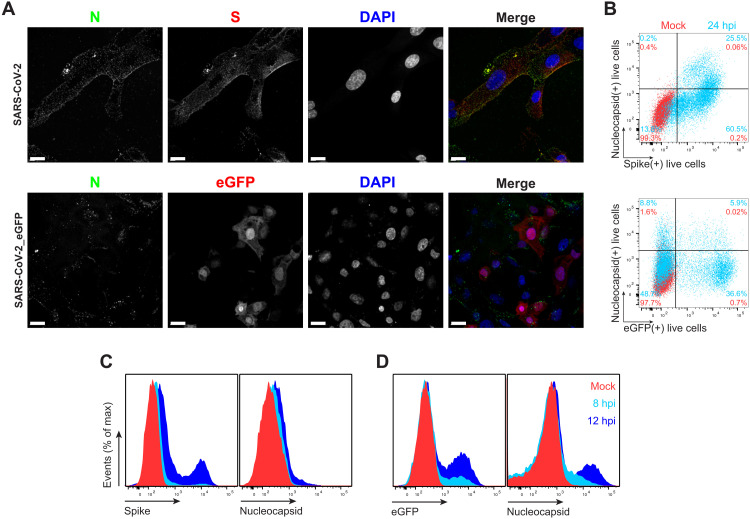
Fig. 1. SARS-CoV-2 N is expressed on the surface of live cells early during infection.
(A) Maximum intensity projections of laser confocal microscopy z-stack images of infected Vero cells with wt SARS-CoV-2 (top) or SARS-CoV-2_eGFP, stained live at 24 hpi (MOI = 1). Scale bars, 20 μm. Images are representative of at least three independent experiments with similar results. DAPI, 4′,6-diamidino-2-phenylindole. (B) Flow cytometry analyses of Vero cells inoculated with wt (top) or eGFP-expressing (bottom) SARS-CoV-2 (MOI = 1), stained live at 24 hpi against SARS-CoV-2 S and N proteins. Representative dot plots of flow cytometry analyses showing double staining of surface S, N, and eGFP proteins, indicating the percentage of the gated cell population for each quadrant of the double staining. Data are representative of at least three independent experiments, each performed with triplicate samples. (C and D) Time course of surface S, N, and eGFP protein expression in live infected Vero cells with wt (C) and eGFP reporter (D) SARS-CoV-2 at 8 and 12 hpi (MOI = 1). Representative histogram overlays of surface S, N, and intracellular eGFP proteins of flow cytometry analyses. Data are representative of one experiment of at least two independent experiments performed in triplicate.

