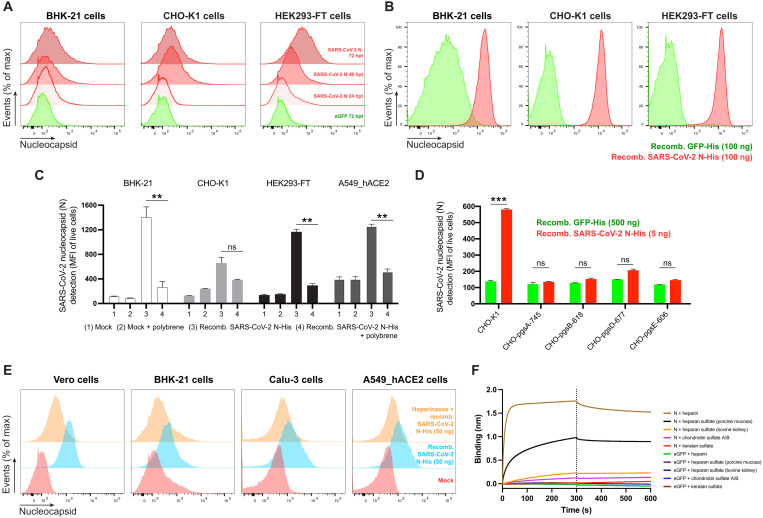
Fig. 2. SARS-CoV-2 N cell surface binding is independent of other viral genes and is specifically mediated by heparan sulfate/heparin.
(A) Histogram semi-overlays of kinetics of surface N protein expression in cells transiently transfected with a plasmid encoding eGFP or N protein, detected with Abs by flow cytometry. hpt, hours post-transfection. (B) Histogram overlays of analyses of exogenous rN binding to different cells, incubated with purified eGFP or rN protein for 15 min, stained with Abs, and analyzed by flow cytometry. (C) Electric charge neutralization assays with a cationic polymer (polybrene). Cells were incubated with 50 ng of rN protein for 15 min and then with polybrene (10 μg/ml), stained with Abs, and analyzed. (D) Different GAG-deficient CHO cells were incubated with eGFP or rN protein for 15 min, stained with Abs, and analyzed by flow cytometry. (E) Heparinase treatment significantly abrogates the cell ability to bind and retain N protein. Histogram semi-overlays of different cells treated with heparinases for 1 hour, incubated with 50 ng of rN protein for 15 min, stained with Abs, and analyzed. (F) BLI sensorgrams from high-throughput screening binding assays of sulfated GAGs to immobilized N or eGFP proteins. SA-coated biosensors were loaded with equivalent amounts of N or eGFP, measuring their ability to bind each GAG. Sensorgrams show association and dissociation phases, where the vertical dotted line indicates the end of the association step. In (C) and (D), the mean fluorescent intensity (MFI) of detected surface N protein from live cells is plotted, showing means ± SEM (n = 2). Student’s two-tailed unpaired t test was used to compare N-incubated cells versus N-incubated and polybrene-treated cells (C) and to compare GFP- versus N-incubated cells (D): ns (statistically nonsignificant) P > 0.01, **P < 0.01, and ***P < 0.001. The analyses were repeated with different protein preparations, and one representative assay of at least three independent assays performed in duplicate is shown.

