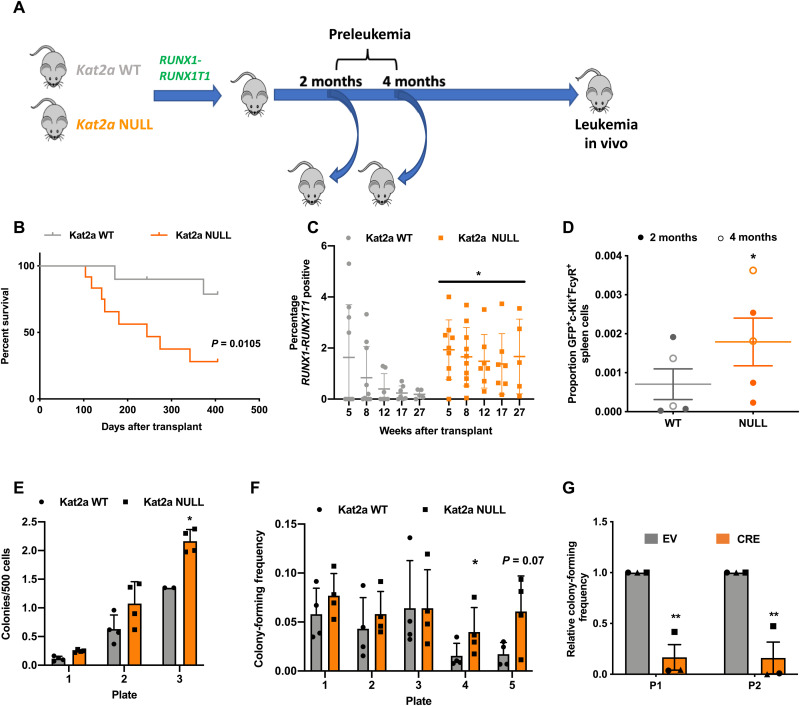
Fig. 2. Kat2a loss accelerates RT1(9a) preleukemia to leukemia progression.
(A) Experimental design. (B) Survival curve of RT1(9a) Kat2aWT and Kat2aNULL Kit+ BM recipients. n = 12 animals per genotype. *P < 0.05, log-rank test. (C) Quantification of peripheral blood green fluorescent protein (GFP) for animals in (A); GFP reports RT1(9a). Mean ± SD, n = 10 animals/genotype (8 weeks). *P < 0.05, two-way analysis of variance (ANOVA). (D) Flow cytometry analysis of RT1(9a) Kat2aWT and Kat2aNULL graft spleen cells 2 and 4 months after transplantation. Mean ± SD, n = 5. (E) CFC assay of RT1(9a) Kat2aWT and Kat2aNULL graft BM cells 4 months after transplantation. Mean ± SD, n = 4. (F) In vitro transformation of Kat2aWT and Kat2aNULL Lin−/Kit+ BM cells transduced with RT1(9a) retrovirus tested in CFC serial replating. Mean ± SD, n = 4. (G) CFC replating (plate = P1 and P2) analysis of RT1(9a) Kat2aFlox/Flox Cre−/−Kit+/Lin− BM cells excised in vitro by lentiviral-delivered Cre recombinase [versus EV (empty vector)] after three rounds of colony replating. Mean ± SD, n = 3. All other analyses two-tailed t test, *P < 0.05 and **P < 0.01.

