FIG. 1.

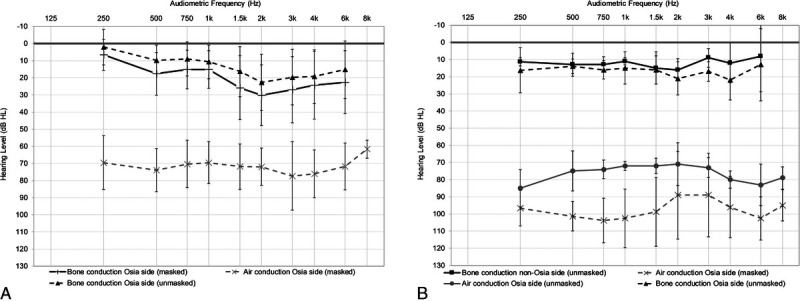
Mean baseline audiograms for subjects with mixed or conductive hearing loss (n = 23; A) or single-sided sensorineural deafness (n = 4; B). Error bars represent the standard deviation of the mean.

Mean baseline audiograms for subjects with mixed or conductive hearing loss (n = 23; A) or single-sided sensorineural deafness (n = 4; B). Error bars represent the standard deviation of the mean.