. 2022 Jul 21;11:e78517. doi: 10.7554/eLife.78517

Figure 1. Patterning of the EC barrier at the single-cell level.

(A) Principal component analysis of the distances within 400 trajectories calculated with integrated data of murine datasets of ear skin, trachea, skeletal muscle, and heart blood endothelial cells (BECs). Colors illustrate the distribution of BECs (CD31+/CD45-/Lyve1-) for each organ. (B) Principal component analysis of trajectory distances colored by the distance along an isolated trajectory spanning from arterial to venous BEC. (C) Mean gene expression for each organ after equidistant binning of the isolated trajectory shown in B. Supervised vessel subset specifications (Top) based on the expression of previously established marker genes. (D) Principal component analysis of trajectory distances colored by the vessel subsets defined in C. (E) Violin plots of gene expression for BEC junctional components. Gene expression was normalized to account for differences in sample library size and has been imputed to account for dropouts in the data as described in Materials and methods. (F) Cldn5 expression in murine BEC datasets scaled per organ according to the mean expression in the arterial BECs of each organ. Red dashed line represents a fivefold reduction in expression compared to arterial BECs. (G) CLDN5 expression in human dermal BECs. n=534 ear skin, 559 trachea, 3498 skeletal muscle, 6423 heart and 8518 human BEC. * denotes statistical significance following differential gene expression analysis (Figure 1—source data 1–5).

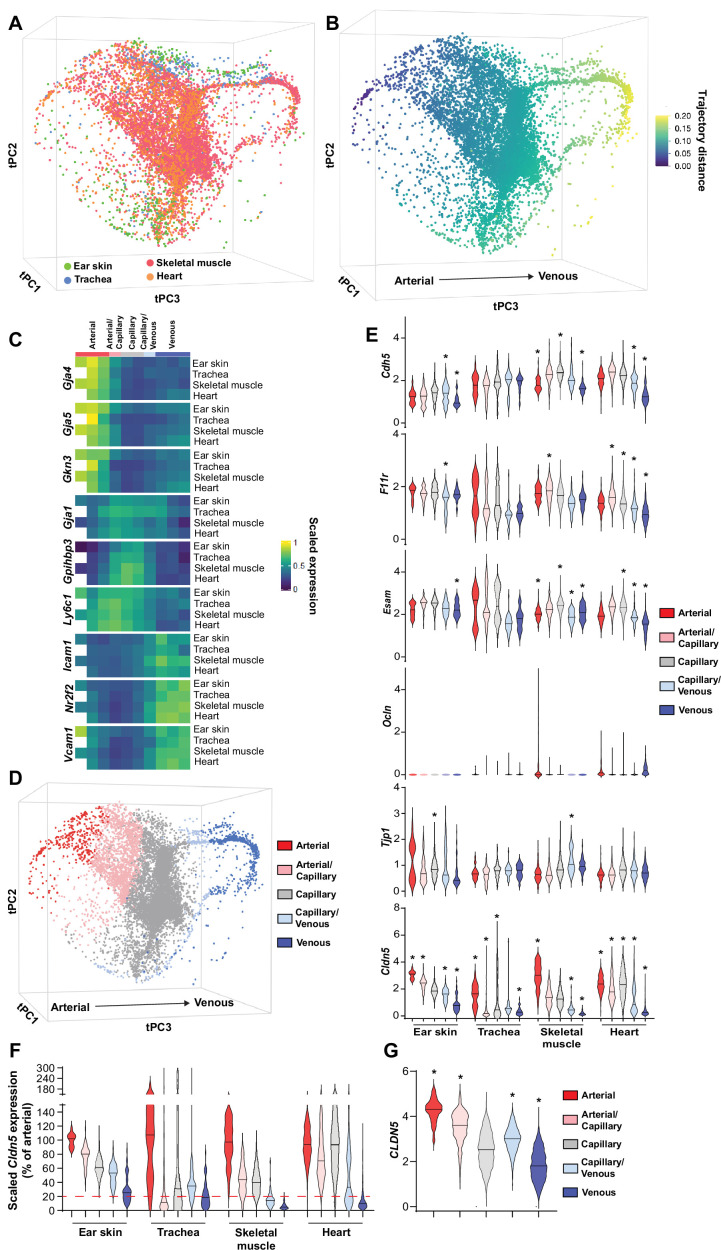
Figure 1—source data 1. Spreadsheets detailing the results of the differential gene expression analysis conducted between mouse BEC subtypes in ear skin.
elife-78517-fig1-data1.xlsx (740.8KB, xlsx)
Figure 1—source data 2. Spreadsheets detailing the results of the differential gene expression analysis conducted between mouse BEC subtypes in trachea.
elife-78517-fig1-data2.xlsx (756.6KB, xlsx)
Figure 1—source data 3. Spreadsheets detailing the results of the differential gene expression analysis conducted between mouse BEC subtypes in skeletal muscle.
elife-78517-fig1-data3.xlsx (768.3KB, xlsx)
Figure 1—source data 4. Spreadsheets detailing the results of the differential gene expression analysis conducted between mouse BEC subtypes in heart.
elife-78517-fig1-data4.xlsx (470.8KB, xlsx)
Figure 1—source data 5. Spreadsheet detailing the results of the differential gene expression analysis conducted between human dermal BEC subtypes.
elife-78517-fig1-data5.xlsx (576.3KB, xlsx)

Figure 1.

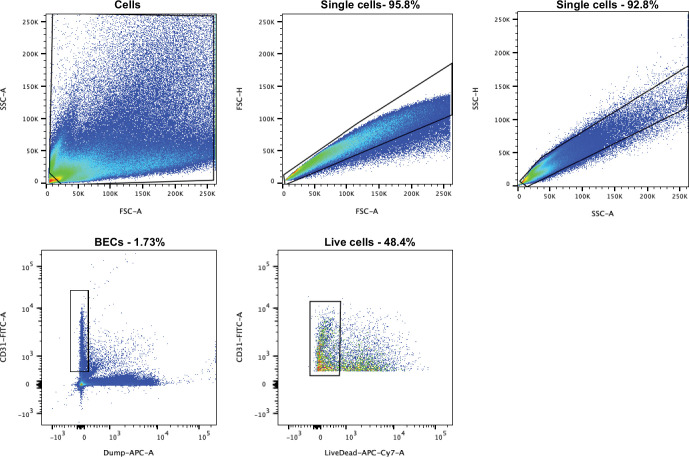
Figure 1—figure supplement 1. Gating strategy for the FACS isolation of single blood vessel BECs from the mouse ear skin.

Figure 1—figure supplement 1.

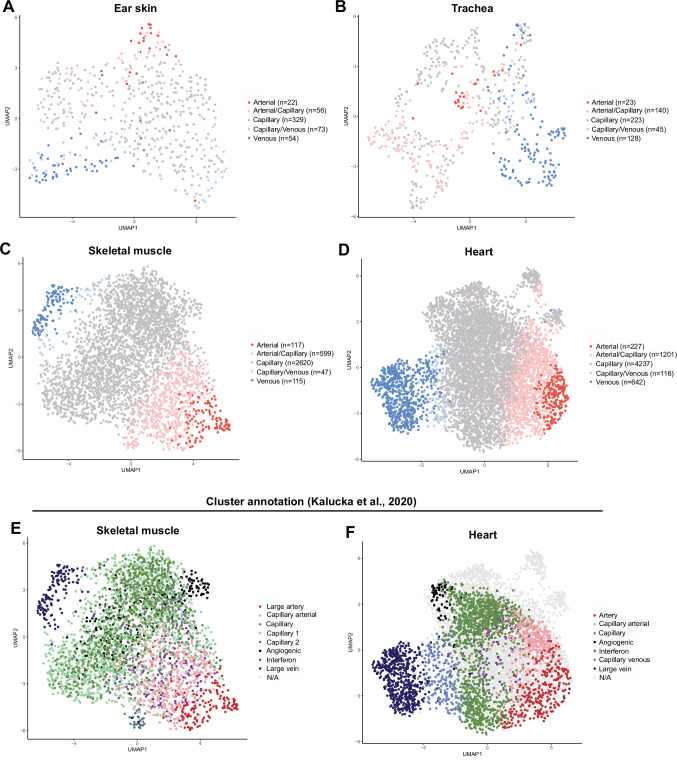
Figure 1—figure supplement 2. BEC subset allocation and clustering of individual mouse organs.

Figure 1—figure supplement 2.

(A) Ear skin, (B) trachea, (C) skeletal muscle, and (D) heart mouse BECs colored by subset as defined by analysis of integrated data. The number of cells in each subtype are specified in each legend. (E) Skeletal muscle and (F) heart mouse BECs colored by clusters identified in the original publication of the data (Kalucka et al., 2020).
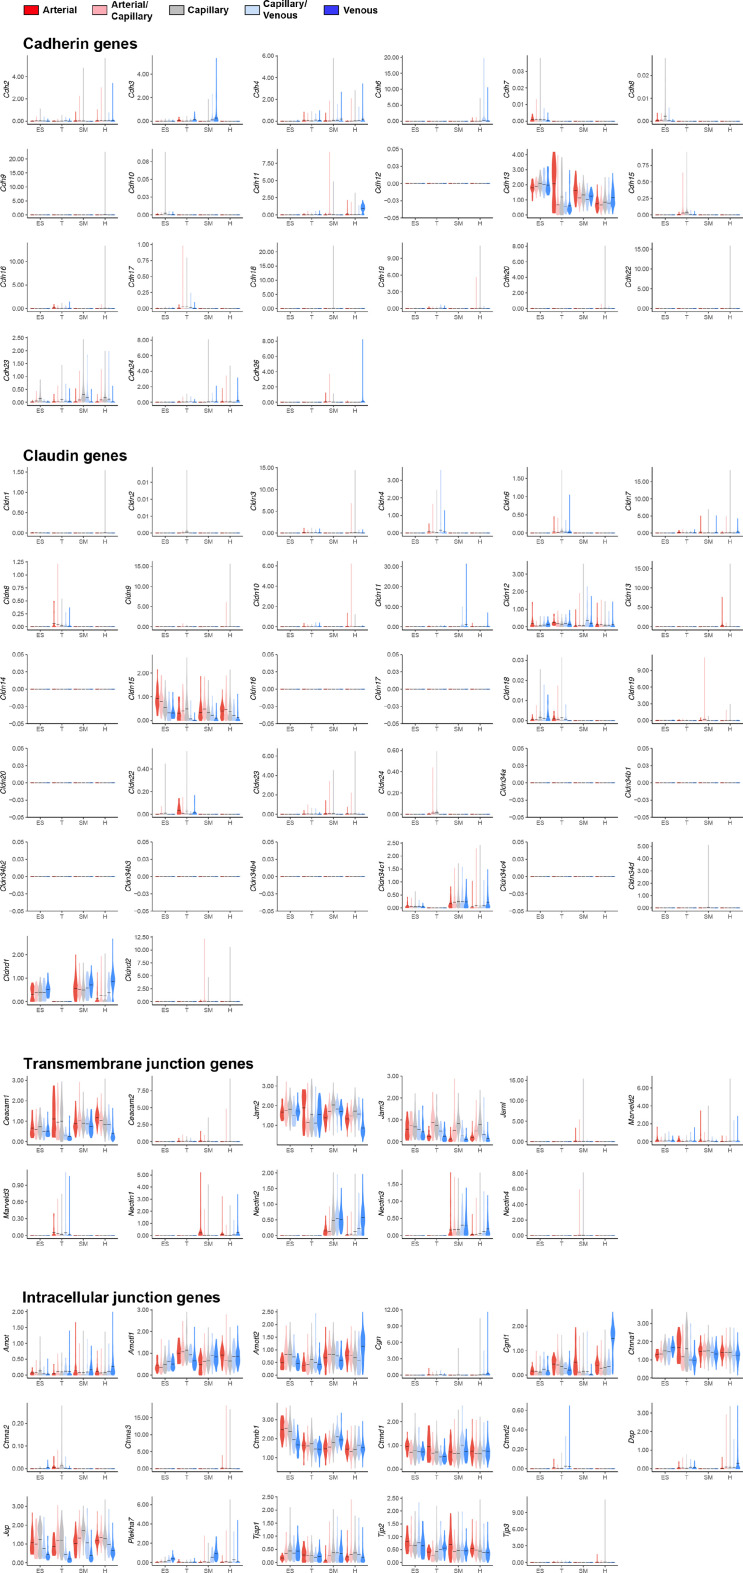
Figure 1—figure supplement 3. Expression of mouse endothelial junctional components.

Figure 1—figure supplement 3.

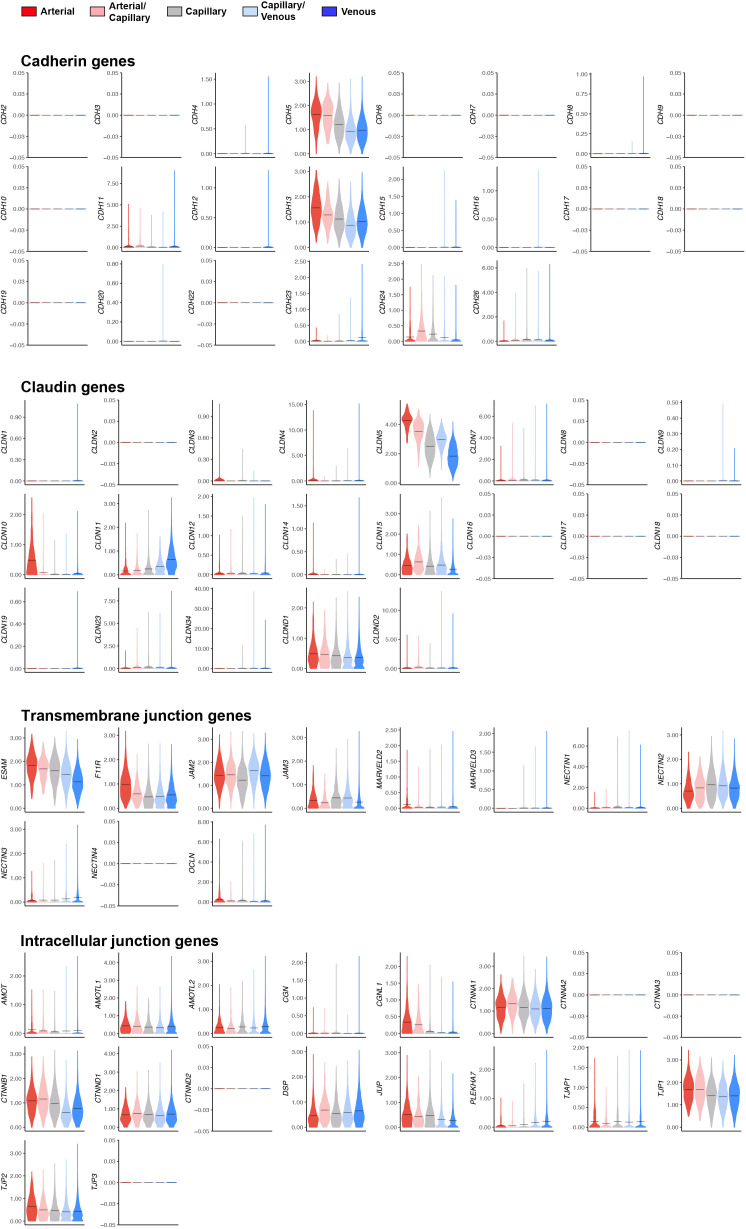
Violin plots of gene expression for mouse endothelial junctional components.Gene expression was normalized to account for differences in sample library size and imputed to account for dropouts in the data as described in Materials and methods. ES, ear skin; T, trachea; SM, skeletal muscle; H, heart.
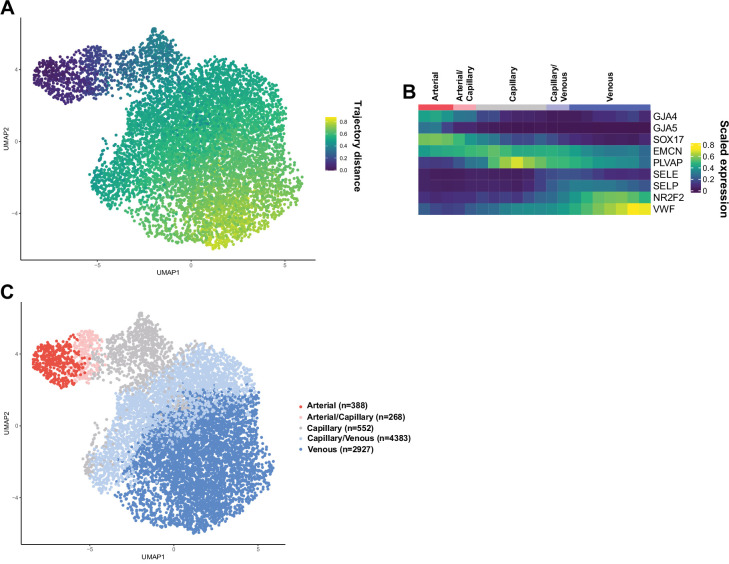
Figure 1—figure supplement 4. Analysis of human skin BECs.

Figure 1—figure supplement 4.

(A) Uniform manifold approximation and projection (UMAP) of human dermal BECs showing the distance of an isolated trajectory calculated with tSpace. (B) Equidistant binning of the trajectory shown in A. with supervised annotation of the bins as vessel subsets. (C) UMAP colored by the vessel subsets specified in B.
Figure 1—figure supplement 5. Expression of human dermal endothelial junctional components.

Figure 1—figure supplement 5.

Violin plots of gene expression for human dermal endothelial junctional components. Gene expression was normalized to account for differences in library size and imputed to account for dropouts in the data as described in Materials and methods.