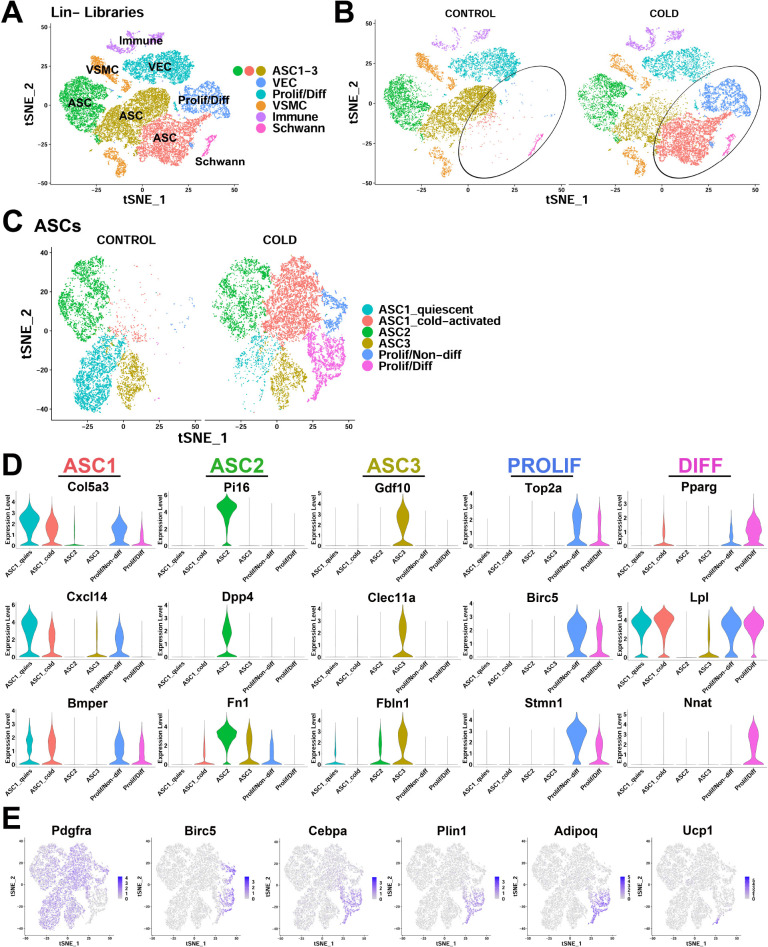
Figure 2. scRNA-seq reveals ASC heterogeneity and maps adipogenic trajectories in mouse iBAT.
(A) t-SNE plot of 28,691 lineage marker negative (Lin-) cells from iBAT of control mice and mice exposed to cold for four days. Clustering identified eight major clusters, highlighted in different colors. ASC, adipose tissue stromal cell; VEC, vascular endothelial cell; VSMC, vascular smooth muscle cells; Prolif/Diff, proliferating/differentiating cells. DEGs that define these clusters are in Supplementary file 1. (B) t-SNE plot from (A) split into cells from the separate treatments (CONTROL and COLD). Circles highlight cold-induced clusters. (C) t-SNE plot of 19,659 re-clustered ASC and Prolif/Diff cells from (A). The t-SNE plot and clustering identified six clusters. Prolif/Non-diff, proliferating/non-differentiating; Prolif/Diff, proliferating/differentiating. DEGs that define these clusters are in Supplementary file 2. (D) Violin plots of log2 expression levels of select marker genes for individual clusters from the CONTROL and COLD data presented in (C). (E) t-SNE plots displaying the log2 expression levels for genes involved in adipogenic differentiation from the CONTROL and COLD data presented in (C).


