Figure 8. ASCs and immune cells comprise a dynamic cellular niche.
(A, top) Representative images of fixed frozen mouse cold-exposed iBAT. Tissue was stained with smFISH probes Dcn (green), H2-Ab1 (red), and Top2a (pink). Nuclei were counterstained with DAPI. Images on the right are a magnified view of the boxed regions on the left. Scale bars, 40 μm and 5 μm. (A, bottom) Quantification of cell types within 20 μm around either an H2-Ab1+ cell or a Dcn+ Top2a+ cell (n=3 animals; >100 cells/mouse; mean ± SD). (B) Representative images of fixed frozen mouse cold-exposed iBAT. Tissue was stained with smFISH probes Dcn (green), H2-Ab1 (red), and Nnat (pink). Nuclei were counterstained with DAPI. Images on the right are a magnified view of the boxed regions on the left. Scale bars, 40 μm and 5 μm. (B, bottom) Quantification of cell types within 20 μm around either an H2-Ab1+ cell or a Nnat+ cell (n=3 mice; >100 cells/mouse; mean ± SD). See also Figure 8—source data 1, Figure 8—source data 2.

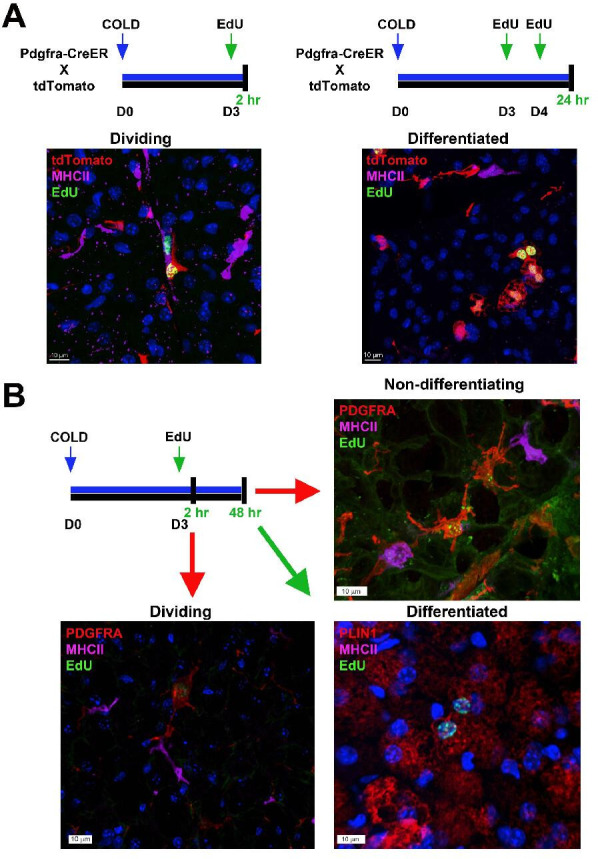
Figure 8—figure supplement 1. Flash-labeling of proliferating cells and proximity of MHCII+ dendritic cells.