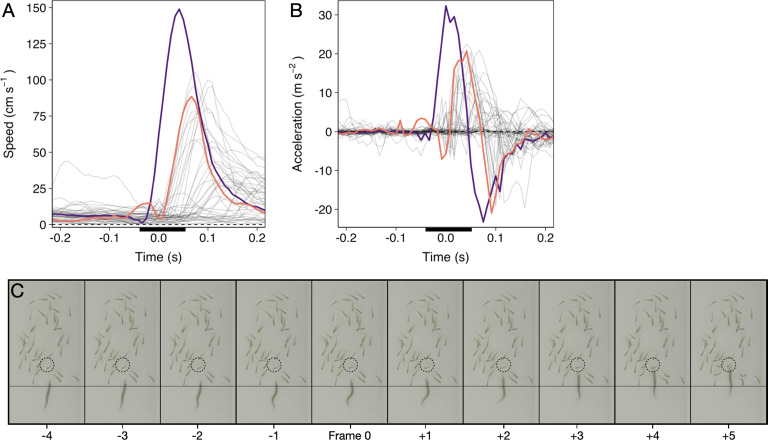
Appendix 1—figure 1. Time series of a randomly selected pike attack.
(A and B) Speed and acceleration curves (based on smoothed data) of the pike (purple) and shiners (grey; targeted shiner in orange). Time is relative to the automatically quantified time of attack. Black bar reflects time series of panel C. (C) Cropped screenshots of the frames around the strike (indicated by the black bar in panels A and B), showing the characteristic S-shaped body posture leading up to the strike, during which the pike’s head stays roughly at the same position (see thin horizontal line). Targeted individual is indicated by the dashed circle. This specific strike lasted a total of 6 frames, or 0.05 s, until impact.

