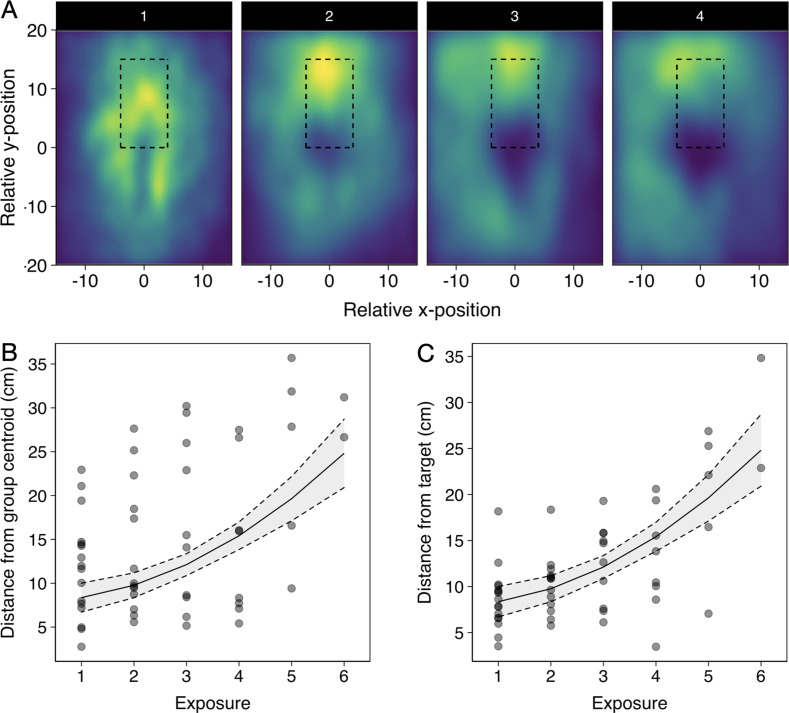
Appendix 2—figure 1. Effects of repeated pike exposure on relative spatial positioning of the shiners and pike.
(A) Heatmaps of the relative position of all shiners to the pike up to strike for all first attempts relative to exposure, with the 4th-6th exposure (panel 4) being grouped due to their smaller sample size, and data subsetted to the relevant region around the pike (nr of datapoints, that is a shiner location at a given frame, per attempt: 1=650.000; 2=528.950; 3=325.570; 4+=319.995). Rectangular area shows the area in which all attacks occurred. (B and C) Plots of the relationship between pikes’ distance to the group centroid (B) and to the targeted individual (C) at 0.5 s before the strike with repeated exposure. Semi-transparent points indicate individual trials. Line and 95% confidence intervals (dashed lines) are from a linear model with exposure fitted as a cubic function. Data was subsetted to pikes’ first attack attempt during the trials.

