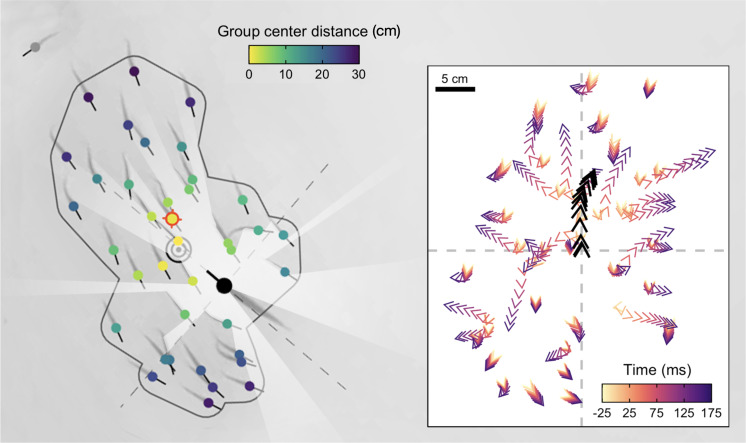
Figure 1. High-resolution tracking of predator attacks.
Cropped image from a sample video trial moments before the attack with key tracking data overlaid. Shiners are coloured yellow to blue based on their distance from the group centroid. Red target indicates the targeted individual, black concentric circles the group centroid, and the dark grey line the automatically determined school boundary based on hierarchical clustering. Rays (white) represent a visualization of the pike’s field of view. Inlay figure presents detailed temporal data of the attack relative to strike initiation, with shiners positioned relative to the pike (black arrows) at the origin facing north.

