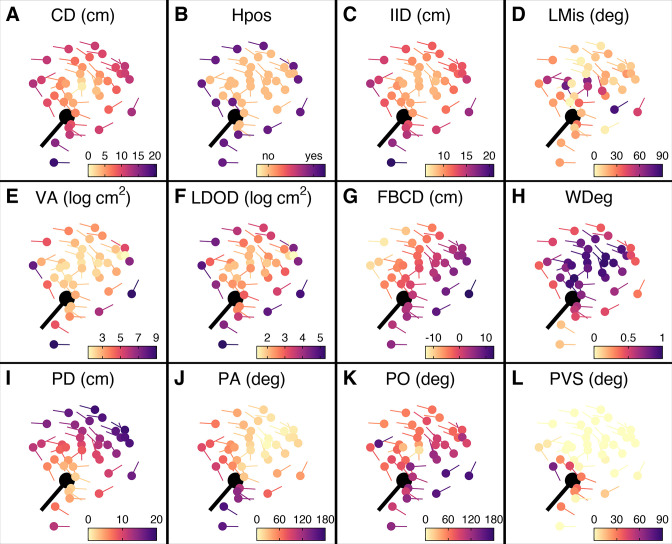
Figure 3. Prey features considered in the multi-model inference approach.
(A–L) Schooling shiners and pike (black) at the time of attack, with the shiners coloured based on the range of features used in our multi-model inference approach. Visualisations show data for a random representative trial and frame. An explanation of the acronyms can be found in Table 1. Note that ranked centre distance (CDrank) and front-back positioning (FBrank) are not included here but will visually resemble plots A and G. Also, for this particular example group rotation was high (0.81) and thus front-back positioning is not meaningful.

