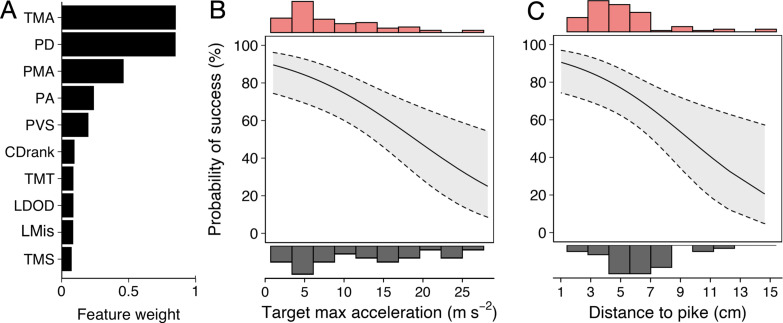
Figure 6. Predictors of Predator Attack Success.
(A) Relative feature weights based on multi-model inference and ranked from highest (top) to lowest (bottom). (B–C) The two key features that best predicted predator attack success: targeted shiners’ maximum acceleration in the half second before the attack (B), and their distance to the pike at the time of attack (C). Plots are created using predicted values from the final model, with the envelope showing 95% confidence intervals. Red and grey histograms are of raw data corresponding respectively to individuals that were targeted successfully and those that evaded the attack.

