. 2022 Aug 3;11:e78129. doi: 10.7554/eLife.78129

Figure 3. Plankton travel time, metagenomic dissimilarity, and environmental differences show different temporal patterns of pairwise correlation.

Spearman rank-based correlations between metagenomic dissimilarity and minimum travel time (Tmin, blue), metagenomic dissimilarity and differences in NO3 + NO2, PO4, and Fe (purple), metagenomic dissimilarity and differences in temperature (turquoise), Tmin and differences in NO3 + NO2, PO4, and Fe (purple, dashed), and Tmin and differences in temperature (turquoise, dashed) for pairs of Tara Oceans samples separated by a minimum travel time less than the value of Tmin on the x-axis. Shaded regions represent SEM. Correlations represent averages across four of six size fractions represented in Figure 2a; the 0–0.2 µm and 5–20 µm size fractions are excluded due to a lack of samples at the global level. Individual size fractions, partial correlations, and correlations with operational taxonomic unit data are in Figure 3—figure supplement 1. Color palette is from microshades (https://github.com/KarstensLab/microshades) (Dahl et al., 2022).
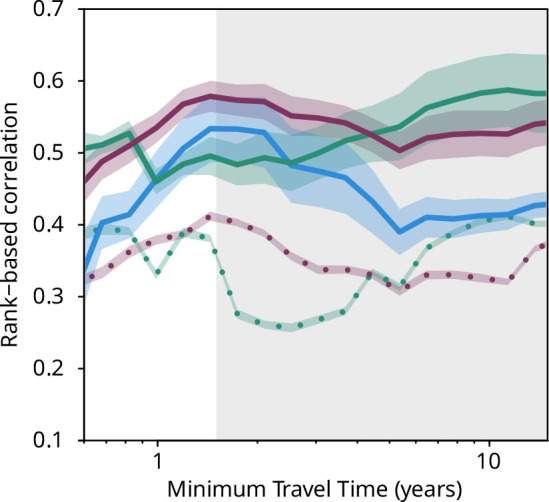
Figure 3.

Figure 3—figure supplement 1. Plankton travel time, dissimilarity, environmental distance, and geographic distance show different temporal patterns of pairwise correlation.

Figure 3—figure supplement 1.

Spearman correlation values are shown separately by organismal size fraction. Non-significant correlations (p>0.01) are shown with dashed lines. (a–e) Correlations for pairs of Tara Oceans samples separated by a minimum travel time less than the value of Tmin on the x-axis. Tmin >1.5 years is shaded in gray. Left panels: correlation of dissimilarity with Tmin, middle panels: dissimilarity with temperature, right panels: dissimilarity with differences in NO3 + NO2, PO4, and Fe. (a–c) Metagenomic dissimilarity. (d-e) Operational taxonomic unit dissimilarity. Correlations for imaging dissimilarity are superimposed on plots in (a) and (c–e) for comparison. There is a maximum correlation of dissimilarity with Tmin (and, for most size fractions, of dissimilarity with nutrients) for Tmin <~1.5 years, but the correlation between dissimilarity and temperature does not display a similar maximum. (b) Displays only the 0.8–5 µm (blue) and 180–2000 µm (orange) size fractions from (a) to highlight that for smaller plankton, correlations with differences in nutrient concentrations were stronger for Tmin up to ~1.5 years, but for larger plankton, correlations were stronger with temperature variations for Tmin beyond ~1.5 years. (c) and (e) Partial correlations to estimate the independent effects of Tmin and environmental distances on β-diversity. Left panels: controlling for differences in temperature and for differences in NO3 + NO2, PO4, and Fe; middle and right panels: controlling for Tmin. Partial correlations do not affect the maximum correlation of dissimilarity with Tmin for Tmin <~1.5 years. (f) Correlation of geographic distance (without traversing land; CGD) with metagenomic dissimilarity or imaging dissimilarity for pairs of Tara Oceans samples separated by a geographic distance less than the value on the x-axis.