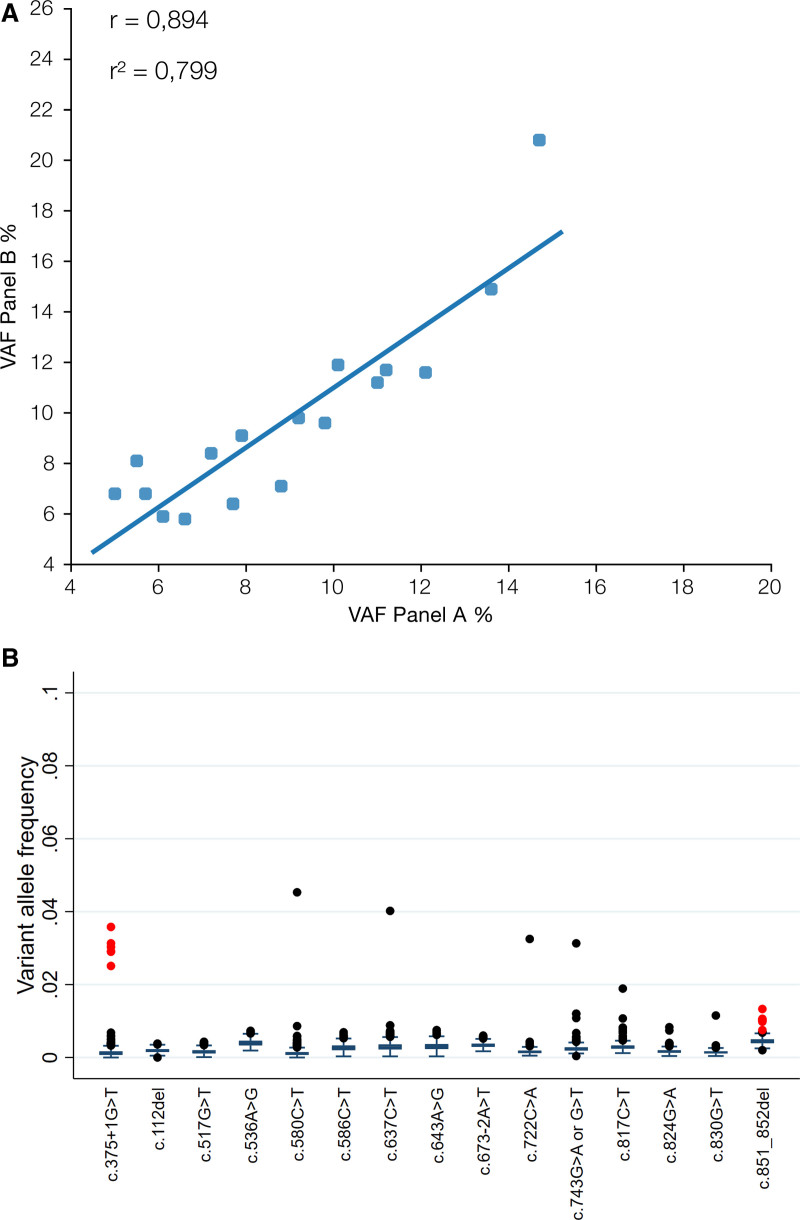
Figure 2.
(A) Correlation of VAFs between the 2 NGS panels. (B) Boxplot of background VAF levels of variants that were detected in the VAF 5%–15% range. Outliers in red represent samples that were included in the same library preparation and the same sequencing run (Suppl. Table S2). NGS = next generation sequencing; VAF = variant allele frequency.

