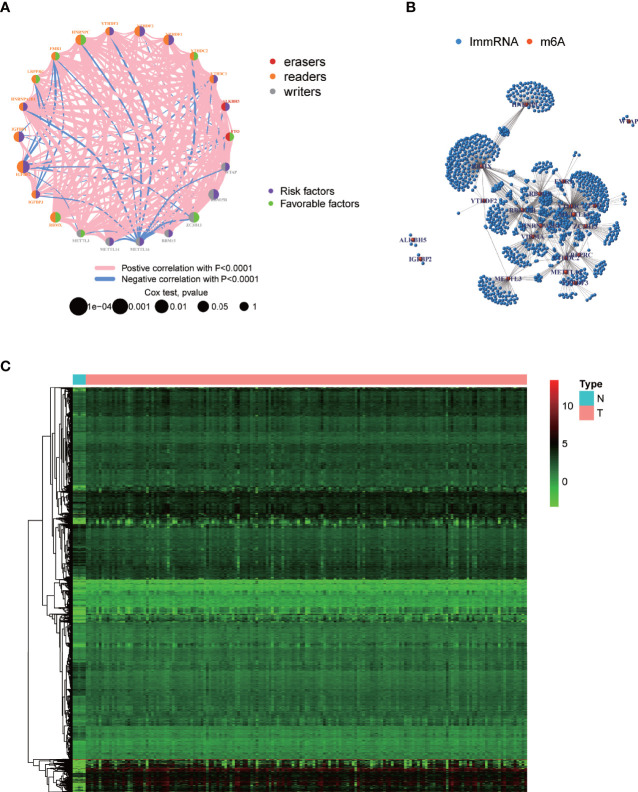
Figure 2.
Visualization of m6A-regulating genes and m6A-associated immune genes. (A) m6A prognostic network diagram by running the psych package. The nodes represent m6A-regulating genes. Red and blue lines respectively indicate positive and negative coexpression relationships. The different colors of the circles indicate the different characters of m6A-regulating genes. The size of the circles indicates the p-values. (B) Coexpression network between m6A-regulating and m6A-associated immune genes based on wilcox.test. Red nodes represent m6A-regulating genes, blue nodes represent m6A-associated immune genes, and the connections represent coexpression relationships. (C) Heatmap of differentially expressed m6A-associated immune genes by running limma package. N, normal group; T, tumor group. Green, black, and red indicate low, medium, and high expression levels, respectively.

