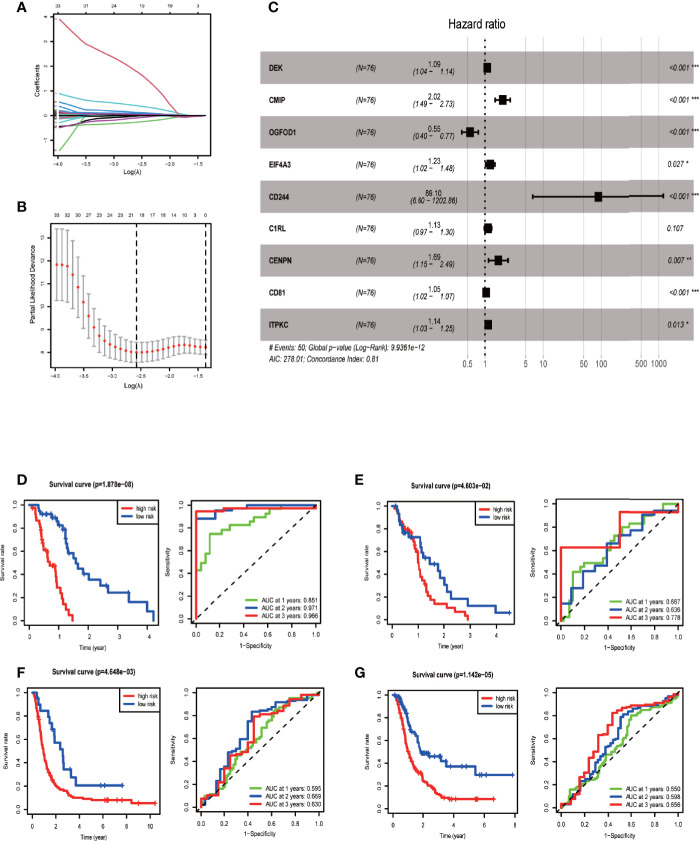
Figure 3.
Establishing and evaluating the prognostic model. (A) LASSO coefficient plot. LASSO coefficient spectrum of 59 genes screened by univariate COX analysis in glioblastoma. Coefficient distribution map for a logarithmic (λ) sequence. (B) λ selection figure. Selecting the best parameters for glioblastoma in the LASSO model (λ) of the training group. (C) Forest map based on multivariate COX regression showing HR values and 95% confidence intervals for all model genes. (D) Model evaluation via survival and ROC curves in the training group. (E) Model evaluation in the internal validation group. (F) Model evaluation in one external validation group (CGGA mRNAseq_325 dataset). (G) Model evaluation in another external validation group (CGGA mRNAseq_693 dataset).

